· Development · 5 min read
Diagram as Code Explained - How Developers Save Time and Stay in Sync
Learn how diagram as code makes creating and maintaining diagrams effortless. With AI tools, you can now describe what you want and let AI generate the diagram code for you.
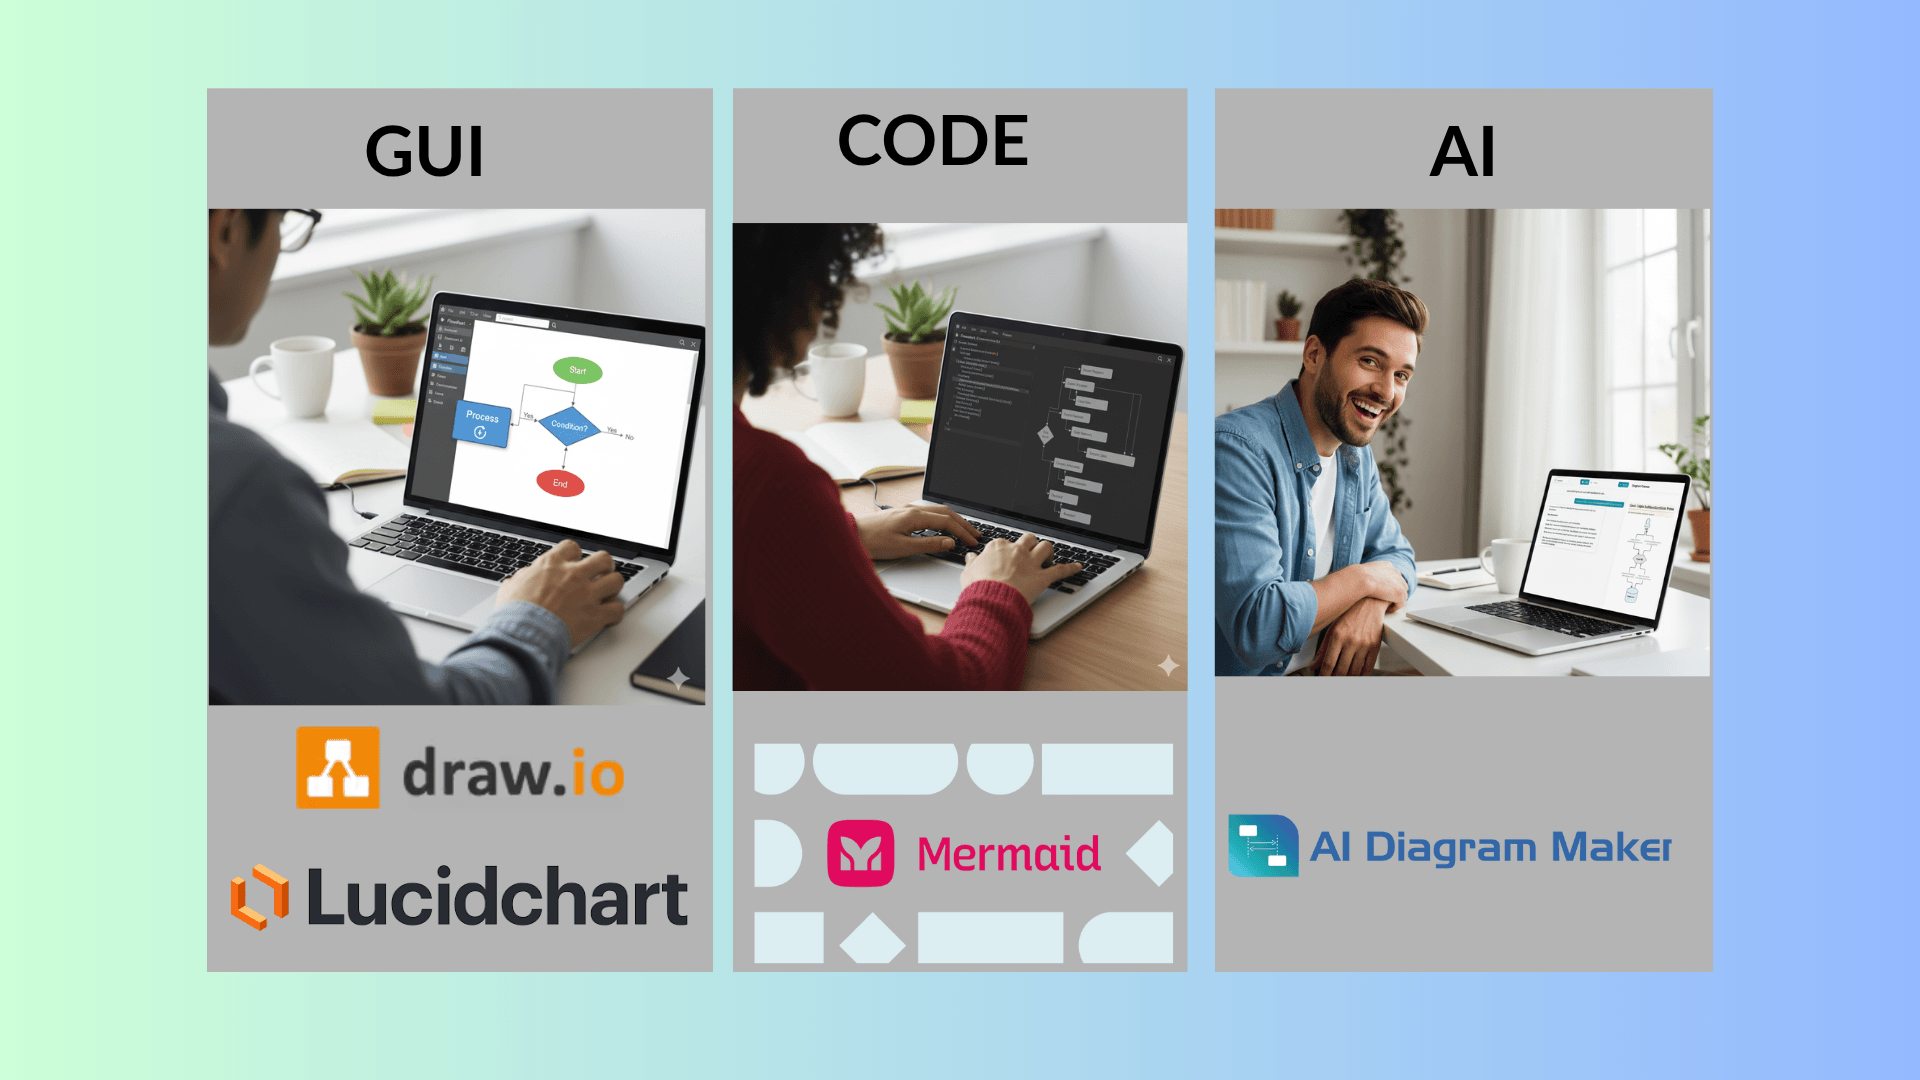
Software systems are complex. Keeping diagrams up to date is even harder. Most teams still use drag-and-drop tools like Visio or Lucidchart, but these diagrams quickly become outdated, hard to share, and painful to maintain.
This is where diagram as code comes in. Instead of drawing by hand, you write a short text description and let a tool generate the diagram for you. Now, with AI and large language models (LLMs), you don’t even need to learn the syntax—just describe what you want, and AI creates the diagram code for you.
Why Diagram as Code?
- Stay in sync – diagrams live in version control alongside your code. No more stale wiki images.
- Save time – tools handle layout and styling automatically.
- Automate – regenerate diagrams in CI/CD pipelines or docs builds.
- Collaborate – teammates can review diagram changes like code.
- AI-ready – LLMs can generate, edit, and explain diagrams instantly.
In short, diagram as code makes diagrams repeatable, consistent, and easy to maintain.
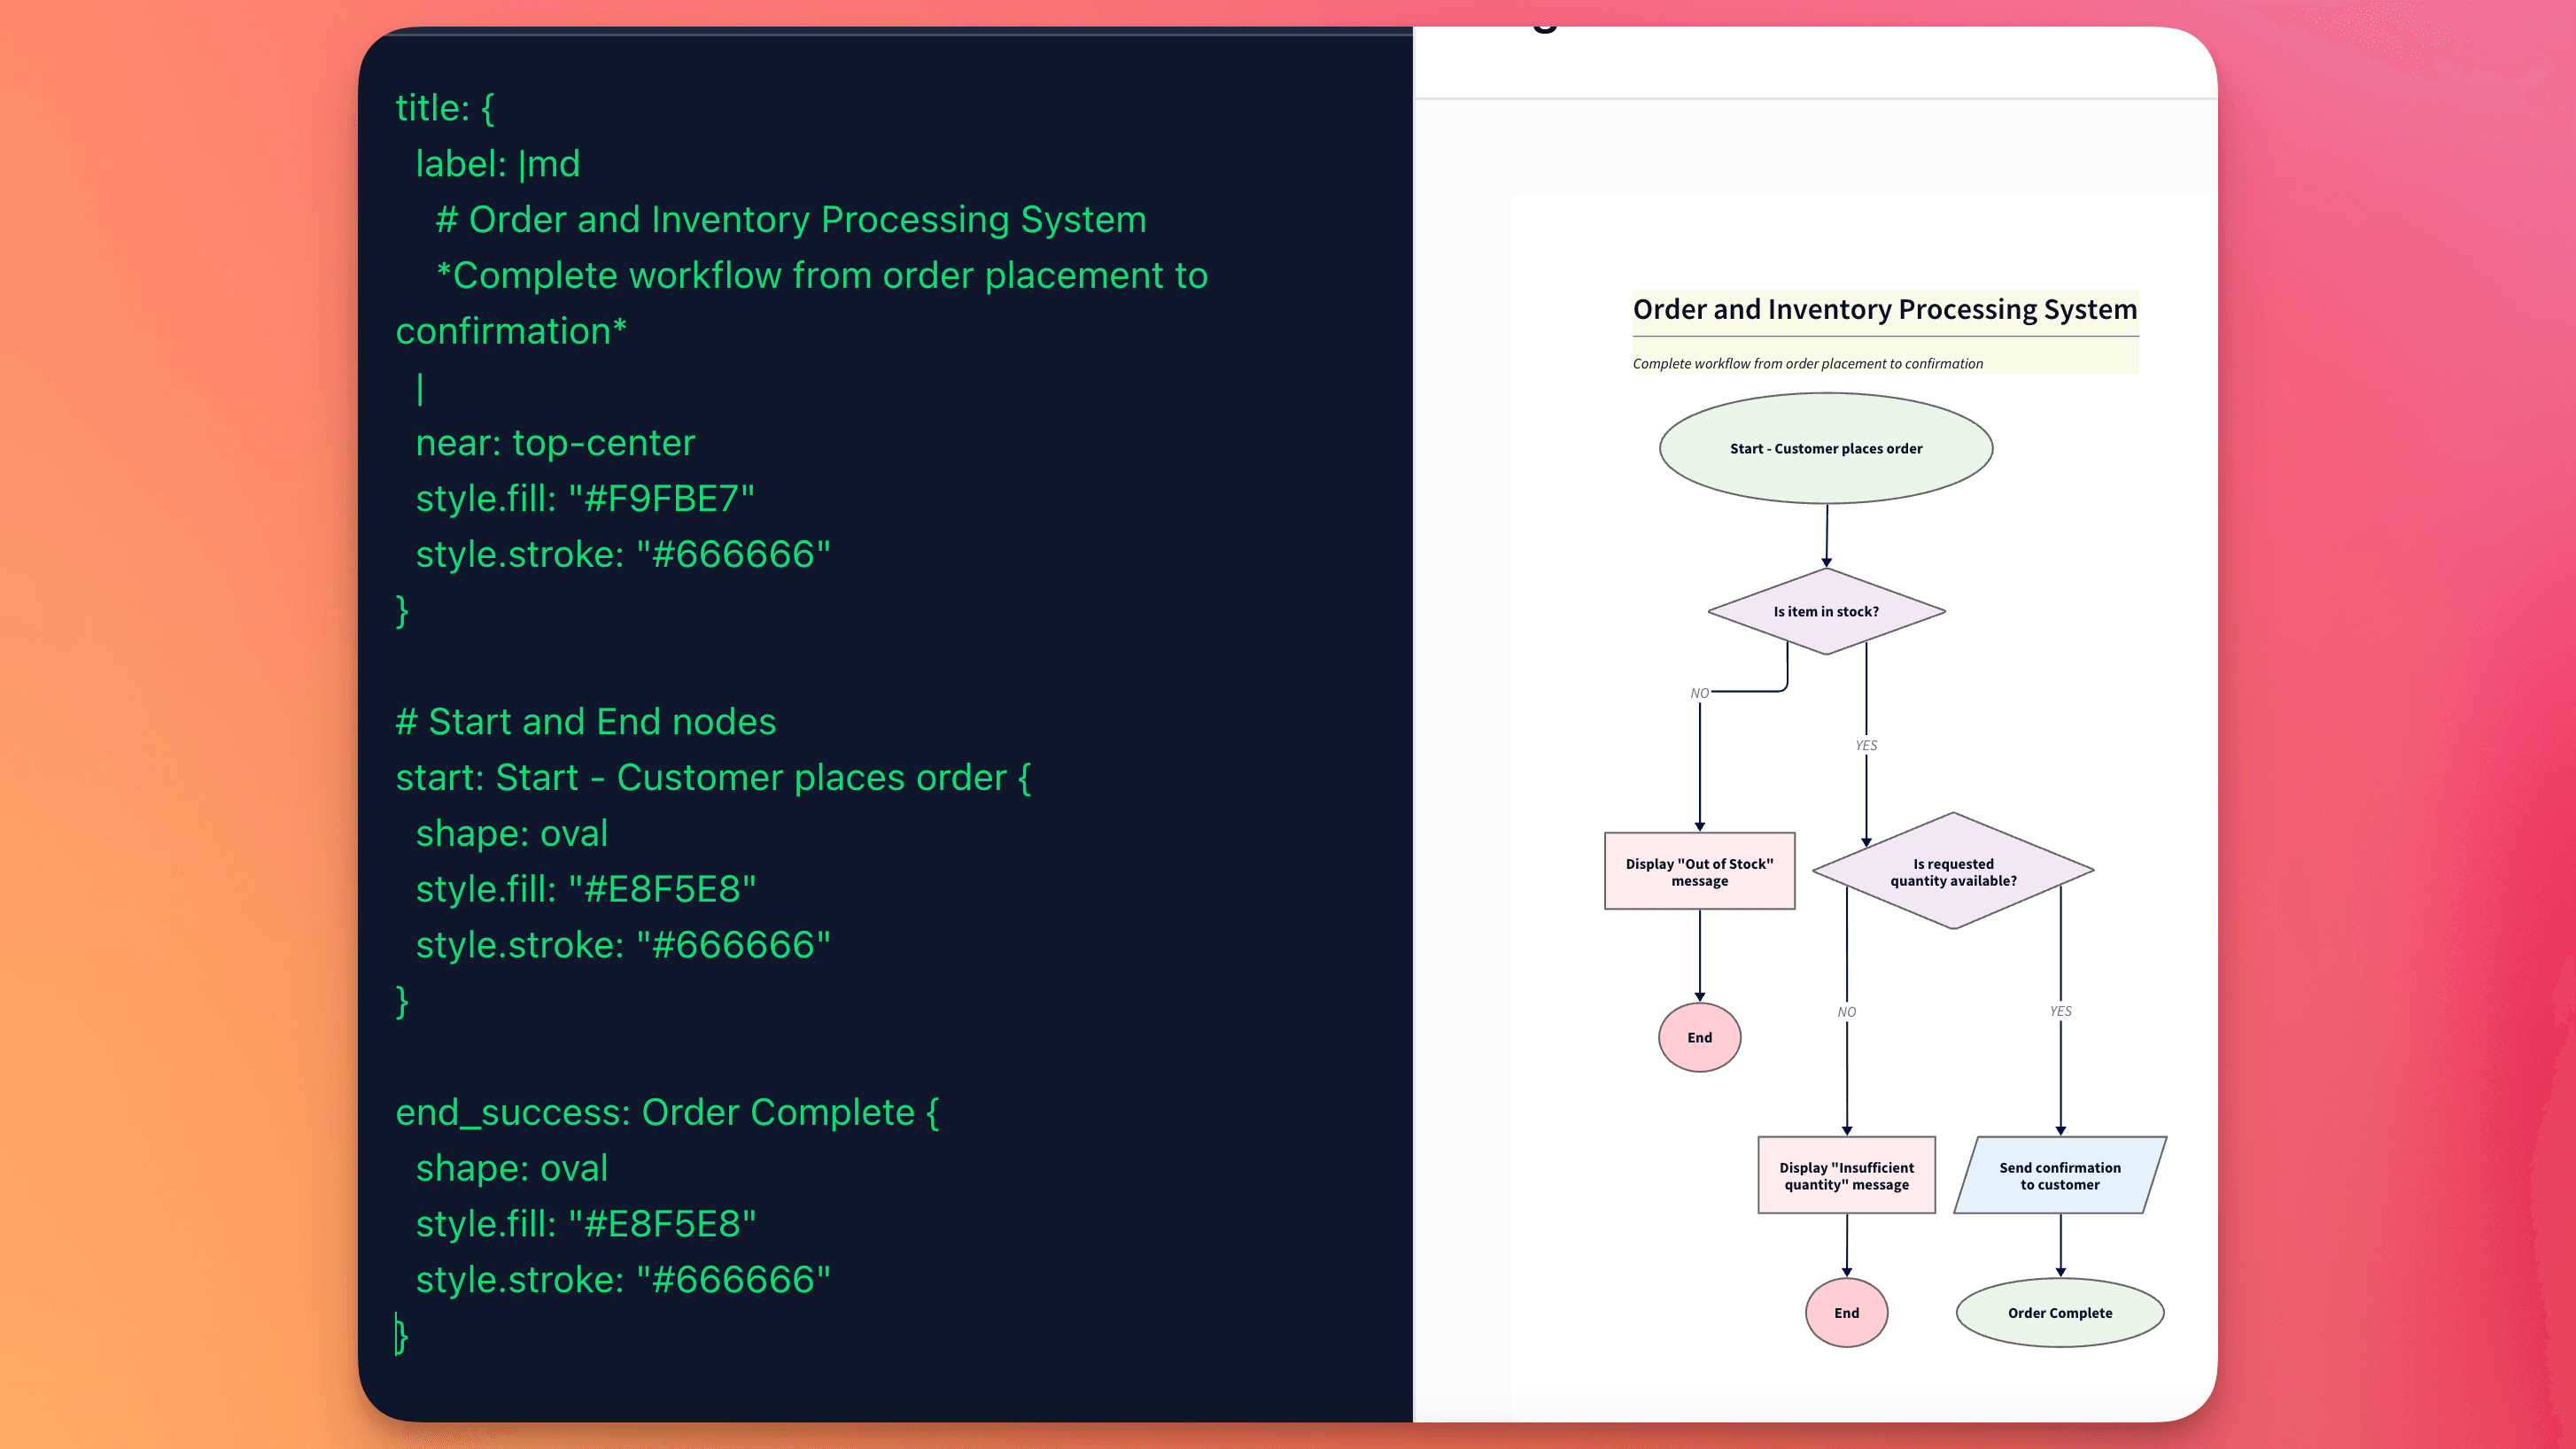
Example: D2 in Action
Here’s a simple example using D2, a modern diagram-as-code language:
# Simple API Database Query Flow
shape: sequence_diagram
# Define main components
user: User {
  shape: person
}
api: REST API {
  shape: hexagon
}
database: Database {
  shape: cylinder
}
# Define the flow
user -> api: "HTTP Request\n(GET /users/123)"
api -> database: "SQL Query\n(SELECT * FROM users WHERE id = 123)"
database -> api: "Query Results\n(User data)"
api -> user: "JSON Response\n(User object)"

# Set layout direction for better readability
direction: down
With a few lines of text, you get a clean architecture diagram without manual drawing
Popular Diagram as Code Languages Compared
Several languages dominate the diagram-as-code space. Here’s a quick overview of the most widely used by developers.
Graphviz (DOT)
One of the oldest tools in this space. Uses DOT language to define nodes and edges.
- ✅ Mature and stable, handles very complex graphs
- ✅ Great for dependency trees and network visualizations
- ❌ Syntax is verbose and low-level
- ❌ Styling is dated compared to newer tools
Best for: automated graph visualizations or large dependency maps.
PlantUML
A veteran tool built around UML, now supports many diagram types.
- ✅ Huge range: class, sequence, activity, component, ERD, and more
- ✅ Strong IDE and wiki integrations
- ✅ Good for UML and C4 model diagrams
- ❌ Steeper learning curve than Mermaid or D2
- ❌ Requires Java or server setup to render
- ❌ Styling looks plain unless customized
Best for: teams doing formal design docs or needing many diagram types in one tool.
Mermaid
Lightweight, Markdown-friendly language widely adopted in docs.
- ✅ Easy to learn, quick syntax
- ✅ Supported on GitHub, GitLab, Notion, Obsidian, etc.
- ✅ Great for embedding in README files or wikis
- ❌ Limited customization and advanced features
- ❌ Complex diagrams can get messy
- ❌ Performance issues for very large diagrams
Best for: documentation diagrams that need to live in Markdown.
D2
A modern tool (2022) focused on simplicity and clean visuals.
- ✅ Single consistent syntax across diagram types
- ✅ Beautiful default layouts with ELK engine
- ✅ Dark mode, theming, “hand-drawn” sketch style
- ✅ Easy to integrate with dev workflows (CLI, VS Code)
- ❌ Ecosystem is still new, fewer integrations than Mermaid
- ❌ No native GitHub rendering yet
- ❌ May lack some UML-specific notation
Best for: software architecture diagrams that should look great with minimal effort.
Quick Comparison Table
| Language | Strengths | Weaknesses | Best For |
|---|---|---|---|
| Graphviz | Handles very large/complex graphs | Low-level syntax, dated visuals | Dependency maps, auto-generated graphs |
| PlantUML | Supports many diagram types, UML, C4 | Steeper learning, needs server/Java | Formal design docs, wide diagram coverage |
| Mermaid | Easy, Markdown support, popular in docs | Limited customization, messy with scale | Documentation, READMEs, wikis |
| D2 | Simple syntax, modern visuals, great layouts | New ecosystem, fewer integrations | Architecture diagrams, quick but polished results |
Diagram as Code + AI = Next Step
With AI tools like ChatGPT or AI diagram makers, you don’t even have to write the code yourself. Just say:
“Create a microservices diagram with an API gateway, user service, payment service, and PostgreSQL database.”
The AI Diagram Maker can create this diagram instantly.

You get diagrams that stay in sync with your system.
Final Thoughts
Diagram as code makes diagrams repeatable, versioned, and automatable. AI now makes it even easier: you describe what you need, AI writes the diagram code, and the tool renders a clean visual.
If you’re tired of outdated diagrams and endless drag-and-drop editing, it’s time to try diagramming this way.