· Scenarios & Use Cases · 7 min read
Documenting a SaaS Architecture in Minutes with AI Diagram Maker
You need to explain your system to a new hire, but your docs are outdated. Learn how to generate a professional SaaS architecture diagram in under 5 minutes using AI.

You’re a tech lead at a startup that’s finally hitting its growth stride. Things are moving fast. The good news is, you just hired a new senior engineer who starts on Monday. The bad news is, you now have to explain your entire architecture to them. You pull up the “official” diagram in the wiki and immediately feel a sense of dread. It’s from six months ago. It’s missing the new billing service, the Redis cache you added to handle traffic spikes, and the third party logging service. This is a common story. The task of updating that diagram feels like it would take half a day, a half a day you really don’t have. This is a classic bottleneck. This post is a quick demonstration of how to solve that exact problem in less time than it takes to make a cup of coffee.
Tl;Dr
In a rush? Here’s the short version. You can create a complete, professional SaaS architecture diagram in minutes using AI. There are two main ways to do it. Method 1 is using a simple text prompt to describe your system, which is perfect for planning or creating a high level overview. Method 2 is connecting your GitHub repository and having the AI generate the diagram directly from your code, which gives you the most accurate, ground truth view of your existing system. Either way, you turn a painful, half day documentation task into a simple, five minute process.
Introduction: The Challenge of the Ever-Evolving SaaS Platform
The scenario I just described is, I think, a universal experience for anyone working at a growing software company. Your platform is constantly changing. New features are added, components are refactored, and third party services are integrated. This is a sign of a healthy, evolving product.
The problem is that our documentation practices can rarely keep up with the pace of development. Manually created diagrams are static snapshots in time. The moment they are created, they begin to decay, becoming less and less accurate with every new pull request. This post will walk through a practical scenario of how to solve this, using a typical SaaS application as our example.
The Goal: Visualizing a Modern MERN Stack SaaS Application
To make this concrete, let’s define the architecture we’re going to try and diagram. It’s a fairly standard setup for a modern web application, something many of us have probably worked on.
Frontend: A React or Next.js single page application.
Backend: A Node.js API Gateway that handles incoming requests.
Microservices: Three distinct services for Users, Payments, and Notifications.
Database: A primary MongoDB database.
Cache: A Redis cache for things like session management or rate limiting.
External APIs: Using Stripe to handle the actual payment processing.
Manually drawing this would involve finding all the right icons, arranging them, connecting them, and labeling everything. It would be a hassle. Let’s do it the easy way.
Method 1: The Text-to-Diagram Approach (For Planning and High-Level Views)
This first method is perfect if you are in the early stages of designing a new system, or if you just need to create a clean, high level overview for a presentation or for a new team member. You don’t need any code. You just need the idea.
The Prompt
The key is to describe the system in plain English, as if you were explaining it to a person. You can provide the components and their relationships in a single prompt.
Prompt Example: “Create a system architecture diagram for a SaaS app. A React frontend communicates with a Node.js API Gateway. The gateway routes requests to three microservices: a User Service, a Payment Service, and a Notification Service. The User and Payment services connect to a primary MongoDB database. The Payment Service also uses a Redis cache for session management and connects to the external Stripe API.”
The Instant Output
You give the AI that prompt, and in a few seconds, it gives you back a complete diagram. It’s not just a random collection of boxes. The AI is smart enough to understand the typical layers of an application. It will likely place the frontend at the top, the API gateway in the middle, the microservices and database below that, and the external API off to the side. It correctly interprets the relationships you described and renders a clean, professional, and easy to understand diagram automatically.
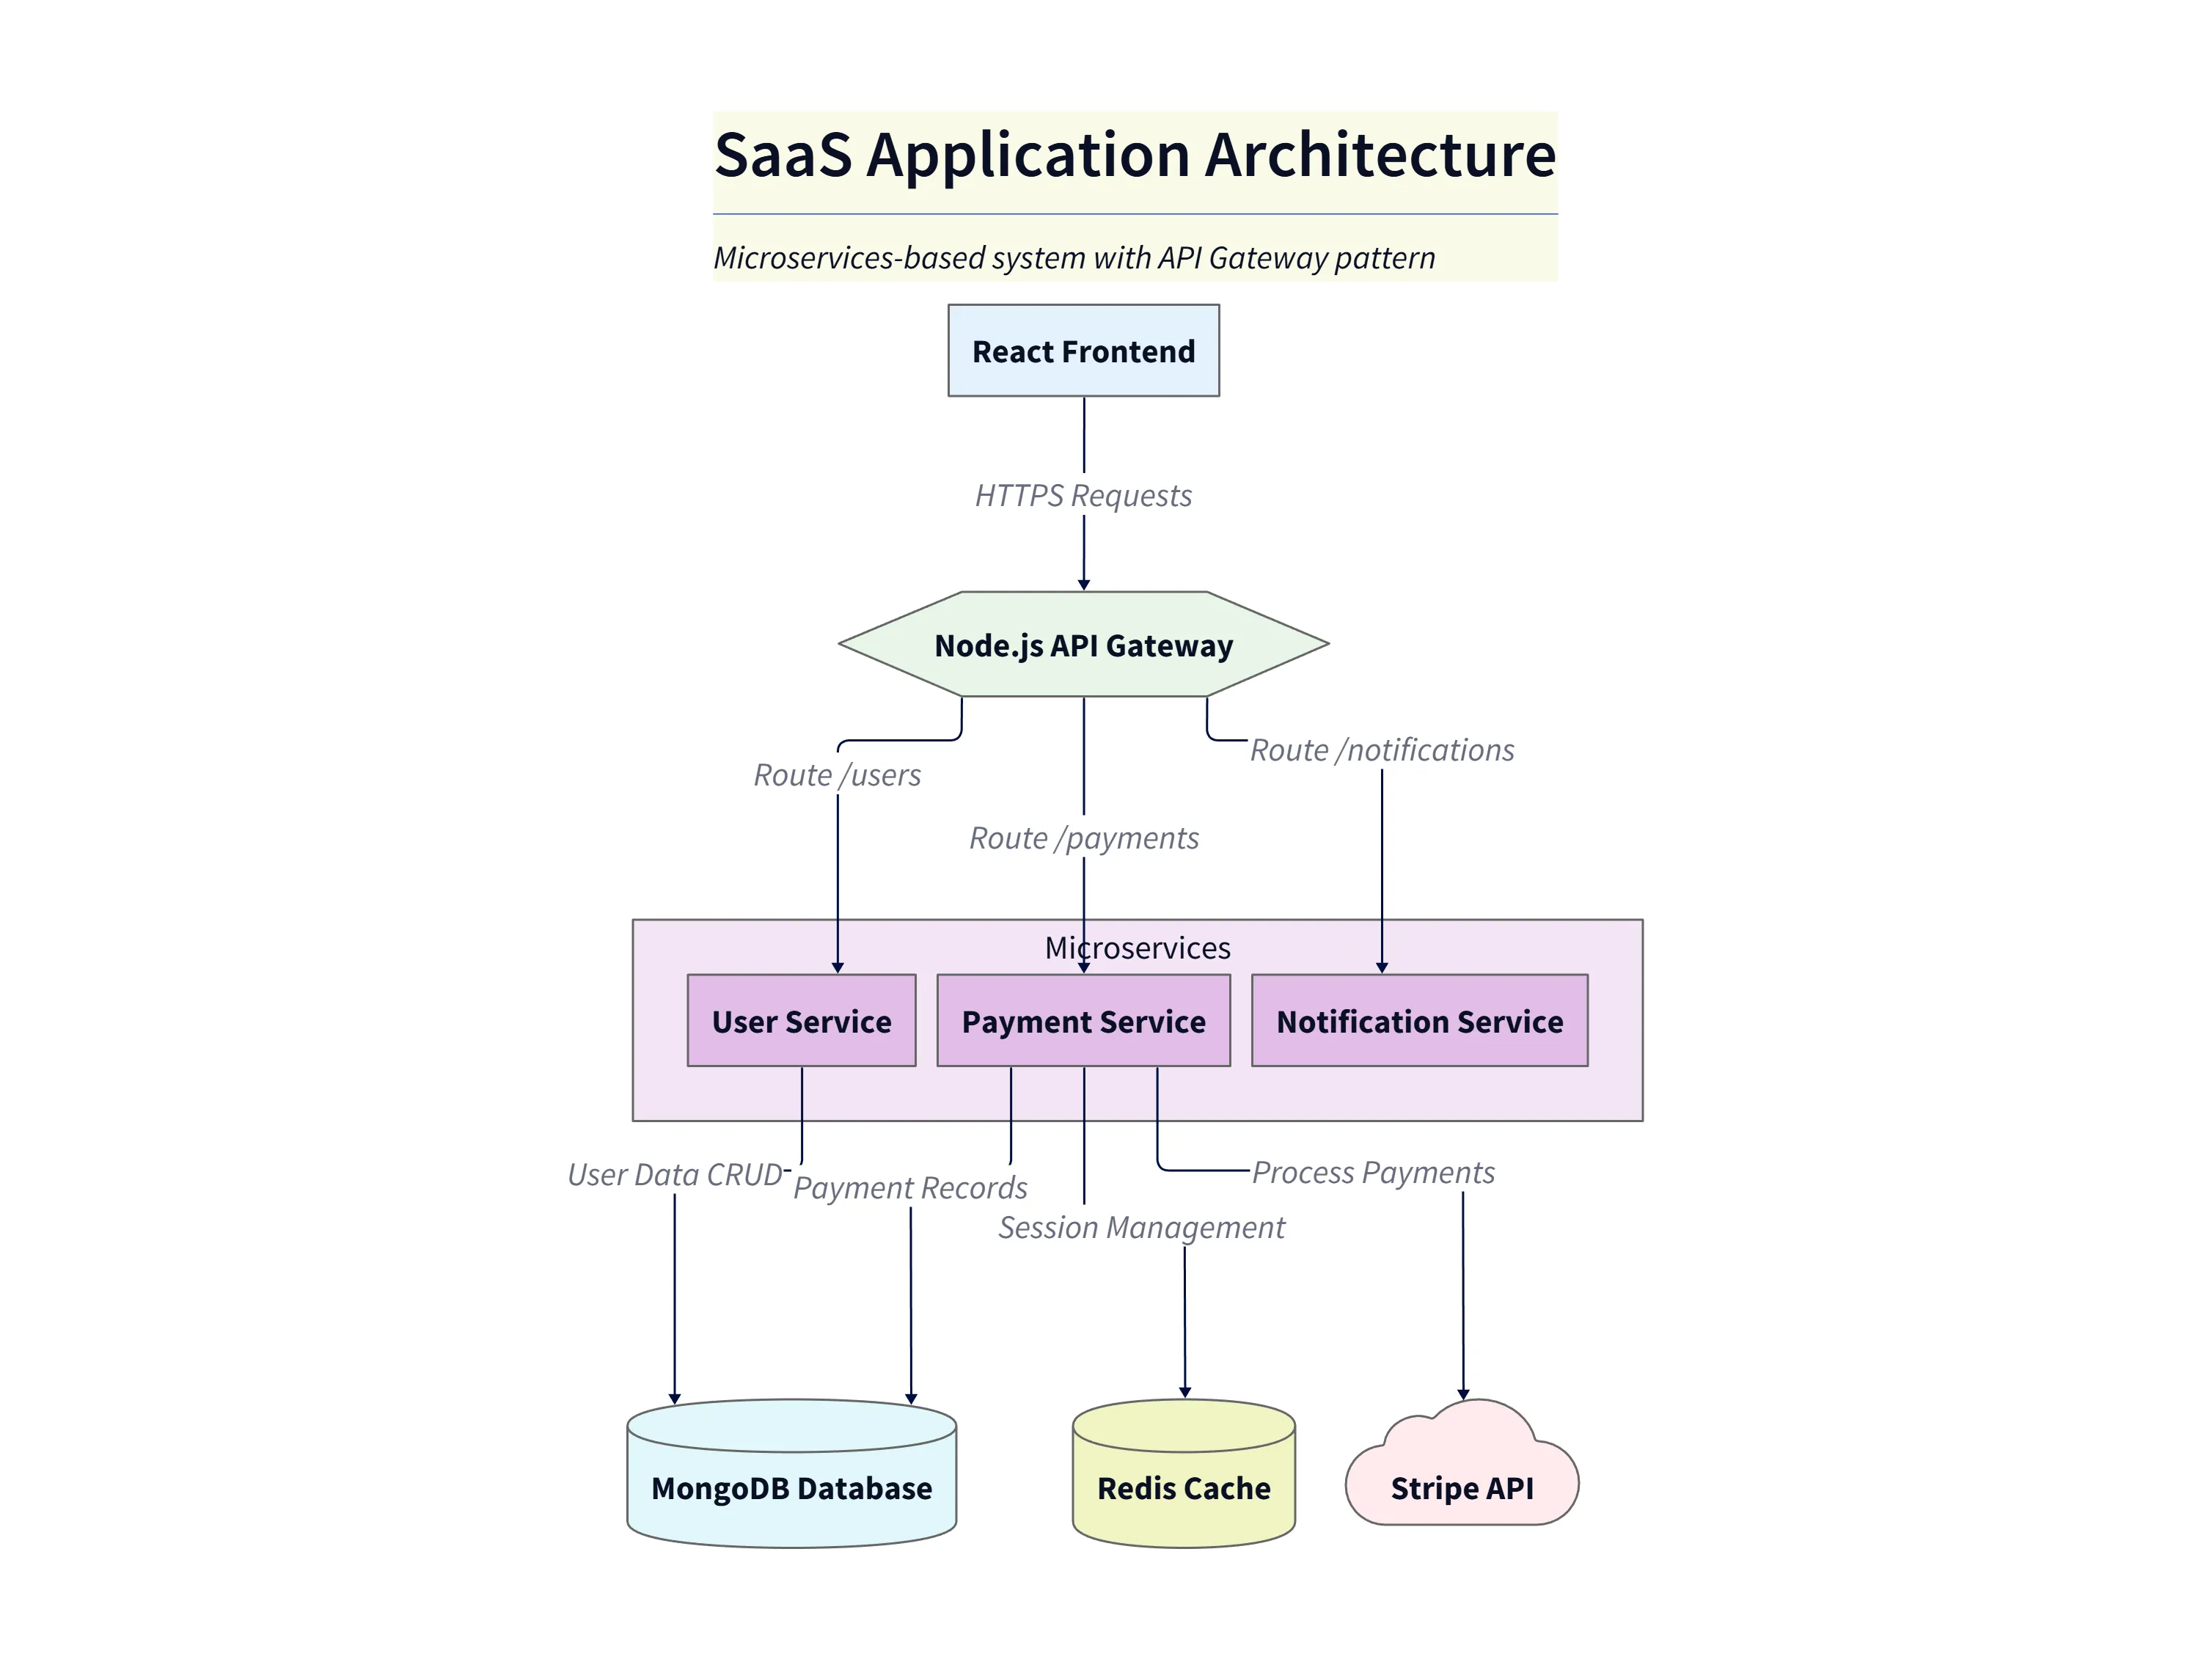
Diagram explanation
- React Frontend → Node.js API Gateway: The user-facing single-page app sends HTTPS requests to a centralized API gateway which terminates incoming traffic and routes requests to backend services.
- API Gateway routes: In the diagram the gateway forwards traffic on logical routes such as
/users,/payments, and/notificationsto the appropriate microservice. - Backend Services (microservices container): Three services—User Service, Payment Service, and Notification Service—are grouped to indicate they are independent deployable services that together form the platform backend.
- Data stores: The User Service and Payment Service persist data to the primary MongoDB database (user profiles, payment records). The diagram shows those connections as the primary data flow for CRUD and record storage.
- Redis cache: The Payment Service also connects to a Redis cache used for session management and short‑lived state (e.g., session tokens, rate limiting, or transient payment state).
- External API: Payment processing is delegated to an external provider (shown as the Stripe API). The Payment Service calls Stripe to complete charges; Stripe is depicted off to the side as a third‑party dependency.
This layout is intended to be a high‑level, accurate mapping of the system: frontend → gateway → grouped backend services → persistence and external APIs.
Method 2: The Code-to-Diagram Approach (For Ultimate Accuracy)
Now, this second method is the real game changer for documenting an existing system. This is how you get a diagram that is not just an illustration, but a genuine reflection of your actual, deployed code.
The Process
The steps here are a little different but still incredibly simple. You connect your AIDiagramMaker account to your GitHub account. You then select the repository, or multiple repositories, that contain your application’s code. You tell it what you want to see, for example a high level architecture diagram, and you click “Generate.”
The Result: A Diagram Based on Truth
The AI will then analyze your source code. It will identify the main services, find the database connection strings, and detect the API calls being made between services. The diagram it produces is the ground truth.
What’s really interesting about this method is that it can sometimes reveal things you didn’t know. It might uncover a dependency you forgot about, or show that a service you thought was deprecated is still receiving traffic. It gives you a more accurate view than the one you could have described from memory.
Refining the Diagram: Adding Detail with Conversational Edits
Whichever method you use to generate the initial diagram, it’s just a starting point. The real power comes from the ability to iterate on it using conversational prompts. Let’s say you have your generated diagram on the screen. You can then refine it just by asking for changes.
Prompt Example 1: “That’s good, but can you group the three microservices inside a container labeled ‘Backend Services’.”
Prompt Example 2: “Okay, now change the color of the Stripe API to orange to indicate it’s an external service.”
Prompt Example 3: “Perfect. Finally, add a note to the Redis cache explaining that it’s used for rate limiting.” With each prompt, the diagram updates, allowing you to add layers of detail and context until it’s exactly what you need.
Conclusion: Your Architecture, Instantly Visualized
The main takeaway here is the massive leverage you get. Whether you’re at the brainstorming stage of a new platform or you’re trying to make sense of a complex existing one, AI diagramming gives you the fastest possible path to a clear, professional, and accurate architecture diagram.
It fundamentally changes the economics of documentation. What used to be a painful, half day task that was almost always skipped is now a simple, five minute process.
Ready to map out your own SaaS architecture? Describe it or connect your repo and let AIDiagramMaker do the rest.