· Developer Tools · 8 min read
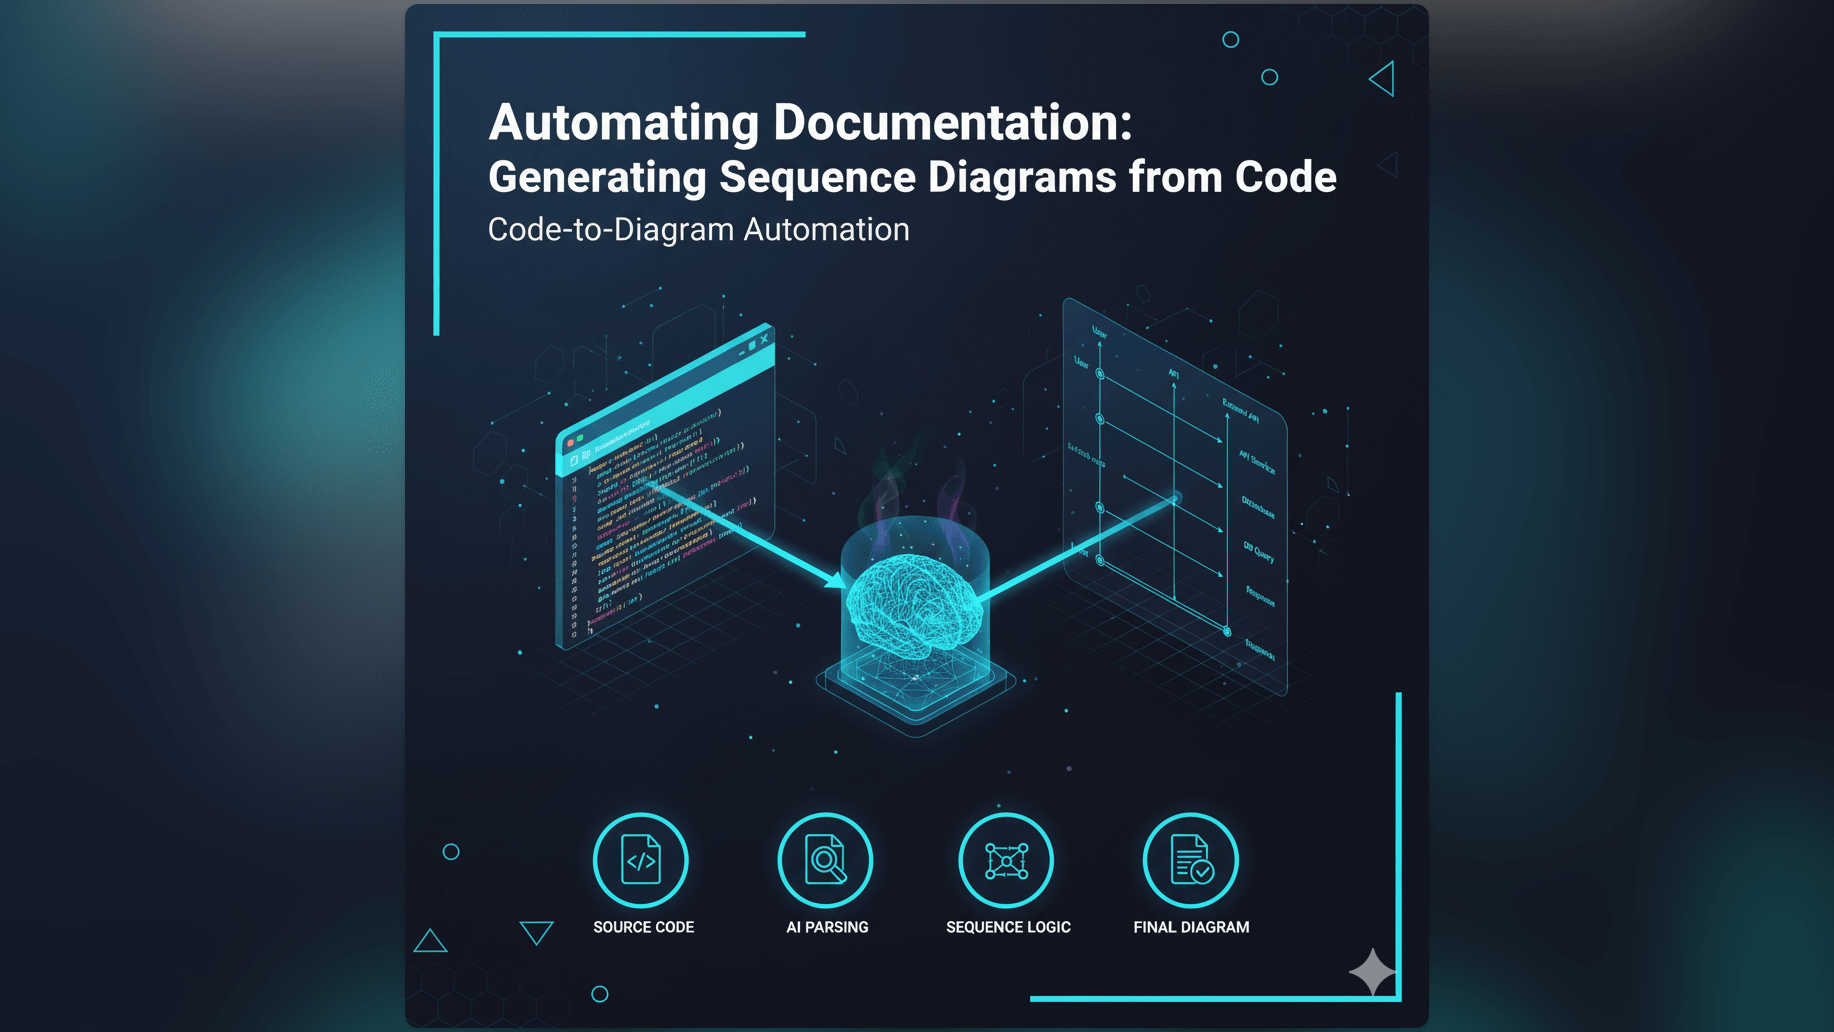
Automating Documentation: Generating Sequence Diagrams from Code
Stop manually tracing execution flows in legacy systems. Learn how to generate professional sequence diagrams directly from Java, Python, and C++ codebases using AI to automate your technical documentation.
We have all been there. You join a new team. You are excited to contribute. You pick up your first ticket. It involves fixing a bug in the “Payment Processing Module.”
You open the repository. You find the file. It is three thousand lines of Java code. There are no comments. The developer who wrote it left the company two years ago to start a goat farm.
You try to read the code top to bottom. It calls a ValidateUser method which calls an external API which puts a message on a queue which triggers a lambda function somewhere else. Your head starts to spin. You are trying to build a mental map of the execution flow but the stack depth is too deep to hold in your working memory.
You think that surely there is a diagram for this. You check the wiki. There is one but it is from 2019 and it references services that don’t even exist anymore.
This is the reality of software development. Code is complex and documentation is usually nonexistent or outdated. We built AI Diagram Maker to fix this specific pain point. We believe that since the code is the source of truth, you should be able to generate your documentation directly from it. This guide focuses on code to sequence diagram generation and how it transforms legacy spaghetti code into clear visual maps.
The Pain of Undocumented or Poorly Documented Codebases
Legacy code isn’t bad code. It is just code that currently makes money and has survived long enough to become difficult. The problem isn’t the syntax. The problem is the intent and the flow.
Why Legacy Systems Are Hard to Onboard and Maintain
When you look at a raw class file, you are looking at the “how” but not the “what” or the “when.” You can see that function A calls function B. But in a complex object-oriented system with inheritance and dependency injection, it is often unclear exactly which implementation of B is being called.
Without a visual aid like a sequence diagram, you are essentially compiling the code in your brain. This is slow. It is exhausting. And it is prone to error. One misunderstood if statement can lead you to spend days debugging the wrong part of the system.
The Time-Consuming Task of Manually Documenting Code Interactions
The traditional solution is to reverse engineer the code manually. You sit there with a notepad. You trace the execution flow line by line.
“Okay so the Controller calls the Service. The Service calls the Repository. Wait there is a try-catch block here. If it catches an exception it calls the Logger.”
Then you open a drawing tool and try to map this out. By the time you are done, you have spent a day just understanding what the code does. And you haven’t fixed the bug yet. Most managers struggle to justify this time, which is why it rarely happens.
The Risk of Outdated Documentation: A Barrier to Understanding
Even if someone took the time to draw a diagram last year, it is dangerous today. Code changes every day.
If the code was refactored to use an asynchronous event instead of a direct call but the diagram still shows a direct call, you are being misled. You might write code assuming immediate consistency because the diagram told you so, only to cause a race condition in production. Manual documentation is almost always out of sync with reality.
Introducing AI Diagram Maker: Your Code to Sequence Diagram Solution
This is where AI changes the equation. We treat code as a language that can be translated. Just as you might translate English to French, we translate Java to sequence diagram or Python to sequence diagram.
How AI Parses Code to Understand Execution Flow
Our AI engine is trained on code structure. When you paste a snippet of code into AI Diagram Maker, it performs a static analysis of the logic. It looks for method calls. It identifies control structures like loops and conditionals. It recognizes when an external library or API is being invoked.
It maps the class instances to lifelines. It maps the method calls to messages. It maps the return values to dashed arrows.
The Magic Behind Java to Sequence Diagram and Python to Sequence Diagram Capabilities
Different languages express interactions differently. In Java, we look for explicit type definitions and class instantiations. We trace the this.service.doSomething() calls. In Python, the dynamic nature makes it trickier but our AI infers the relationships based on context and variable usage. It sees requests.post() and knows that is an outbound HTTP message.
The result is a standardized UML sequence diagram that accurately represents the execution flow defined in your source code.
The Goal: Automatic, Up-to-Date Visual Documentation from Your Source
Our goal is to give you “documentation on demand.” You shouldn’t have to pre-generate diagrams for every file. When you are stuck on a file, you should be able to just grab the code, generate the visual, understand it, and move on. It turns documentation from a chore into a tool for understanding.
Practical Applications for Code to Sequence Diagram Generation
This isn’t just a cool party trick. It solves real engineering problems that cost teams money.
Reverse Engineering and Documenting Legacy Codebases
This is the most common use case. You are tasked with breaking a monolith into microservices. You need to know exactly where the dependencies are.
You paste the core logic of the monolith into the tool. The generated diagram reveals the spaghetti. “Oh wow, the User Service is directly querying the Inventory Database here.” You see the coupling instantly. You can now plan your refactor with eyes wide open.
Onboarding New Developers to Complex System Interactions
When a new hire starts, you usually tell them to “read the code.” That is like telling someone to learn how a car engine works by looking at a pile of screws.
Instead, you can give them a visual. “Here is the sequence diagram for the checkout flow generated from the current production code.” They can see the interaction between the Cart, the Payment Gateway, and the Email Service. They get the high-level picture in five minutes instead of five hours.
Validating Design Against Actual Code Implementation
Sometimes the code drifts away from the design. The architect designed a clean layered architecture. The junior dev took a shortcut and bypassed the service layer.
By generating a diagram from the actual code, you can compare it to the original design doc. The difference becomes obvious. You can catch these architectural violations during code review before they become permanent technical debt.
Rapidly Generating Documentation for Microservice Communication
In distributed systems, no single person knows how everything works. By using our AI sequence diagram generator for specific API handlers, you can document the contract between services. You can show exactly what happens when the OrderService receives a POST /create request. You can see the cascading calls to downstream systems.
The AI Diagram Maker Workflow: From Code Snippet to Sequence Diagram
We designed this workflow to fit into your existing dev loop. We know you live in your IDE, so we made the handoff seamless.
Step 1: Inputting Your Code
You are in VS Code, Cursor, or Windsurf. You highlight the confusing function or class. You hit Cmd+C. You switch to AI Diagram Maker. You paste the code into the input box. You can also add a small prompt like “Focus on the happy path” or “Show me the error handling flow.”
Step 2: AI Analyzes and Extracts Interaction Logic
The engine processes the syntax. It abstracts away the noise. It ignores the import statements and the variable declarations that don’t affect the flow. It focuses purely on the interactions.
Step 3: Generating a Visual Sequence Diagram
In seconds, the visual appears. You see the actors at the top. You see the time flowing downwards. You see the messages passing back and forth. It is auto-formatted. The lines are straight. The text is readable.
Step 4: Reviewing, Refining, and Exporting for Documentation
Now you check it. Does it look right? If the code was particularly messy, the diagram might be too complex. You can use our chat features to simplify it. “Group the logging calls into a generic ‘Logger’ lifeline.” “Hide the database connection setup steps.”
Once it is clean, you export it to SVG. You commit it to your repo alongside the code. Now you have a visual artifact that is version-controlled and tied to a specific commit.
Why Developers Need Code to Sequence Diagram Functionality
- Saves Hours of Manual Documentation Effort: We estimate that drawing a complex sequence diagram by hand takes at least an hour. Generating one from code takes less than a minute. The ROI is immediate.
- Ensures Accuracy and Consistency with the Codebase: A manual diagram is an artist’s interpretation of the code. A generated diagram is a factual representation of the code. It removes the human bias.
- Accelerates Understanding of Complex Systems: Visual information is processed differently by the brain. Seeing the “shape” of the interaction allows you to intuit how the system works faster than reading text.
- Facilitates Easier Code Reviews and Collaboration: Imagine pasting a sequence diagram into your Pull Request description. The reviewer doesn’t just have to read your diff: they can see the flow change visually.
This capability is a core part of our mission to improve developer velocity. We cover more about the specific diagramming tools in The Developer’s Guide to AI Diagramming but for working with existing code, this automated approach is unbeatable.