· Developer Tools · 10 min read
The Developer’s Guide to AI Diagramming: Flowcharts, ERDs, & UML (No Drag-and-Drop)
This guide explores how AI is revolutionizing technical diagramming for developers, architects, and product managers. Learn how to move beyond manual drawing tools to faster, more accurate visual documentation.

This guide explores how AI is revolutionizing technical diagramming for developers, architects, and product managers. We will cover AI driven creation of flowcharts, ER diagrams, and UML diagrams, showcasing how to move beyond manual drawing tools to faster, more accurate, and easily maintainable visual documentation.
TL;DR: Developers hate dragging boxes. It’s slow, boring, and the moment you finish, the code changes and the diagram is wrong. We built AI Diagram Maker to fix this. You describe your logic, paste your SQL, or input your code, and we generate the diagram for you. No manual drawing. Plus, with native GitHub integration, your diagrams finally live alongside your code.
Why Traditional Diagramming Fails Developers: The Speed vs. Detail Dilemma
If you write code for a living, you know the feeling. You need to explain a complex system architecture to a stakeholder, or maybe onboarding a junior dev to a legacy codebase. You know a diagram would solve the confusion instantly.
But then you look at your options.
You could open Miro or Lucidchart. You stare at a blank white canvas. You drag a box. You type “User Service.” You drag another box. You type “Auth Service.” You draw a line. It’s crooked. You spend 45 seconds trying to align the arrow.
By the time you have mapped out three microservices, you are already bored. And the worst part? You know that as soon as you merge your next PR, this diagram is technically a lie because the architecture changed.
The Hidden Costs of Manual Tools
The cost isn’t just the subscription fee for these tools. It is your time. “Developer velocity” is a metric we all care about, yet we spend hours acting like graphic designers.
When you use manual drag and drop tools, you aren’t thinking about the logic of the system. You are thinking about the layout of the boxes. That is a waste of a purely engineering brain.
The Pain of Keeping Diagrams Synced with Code
This is the killer. Code moves fast. Visuals move slow.
Because updating a manual diagram requires opening a separate tool and moving shapes around, nobody does it. The documentation rots. A few months later, a new hire looks at the diagram, builds a feature based on it, and breaks production because the diagram referenced a database table that was deprecated six months ago.
The Frustration of Starting from a Blank Canvas
There is also that initial friction. Starting from zero is hard. You have the SQL dump or the Java class files. You have the data. But translating that into a visual structure manually is a high cognitive load task. You have to translate code to shapes in your head, then put them on the screen.
Introducing AI Diagramming: A Paradigm Shift for Engineers
We believe there is a better way. It’s a shift from “drawing” to “generating.”
How AI Transforms Text into Structured Diagrams
AI is really good at understanding structure. If you feed it a paragraph explaining a user registration flow, it understands the conditional logic. If you feed it a CREATE TABLE statement, it understands the schema.
We leverage this to act as an intermediate layer. You provide the text: whether it’s natural language, code, or a rough note: and our engine handles the rendering. We decide the layout. We pick the colors. You just check the logic.
The Core Philosophy: Describe, Don’t Draw
Our philosophy at AI Diagram Maker is simple: Describe, Don’t Draw.
You already describe systems every day in Pull Requests, documentation, and Slack messages. Why shouldn’t that text be enough to create a visual? We think it should be.
The Power of Diagram-as-Code Without the Steep Learning Curve
Tools like Mermaid.js are great. We love the Diagram-as-Code movement - but let’s be honest, debugging a syntax error in a Mermaid script is annoying. You missed a bracket, and the whole chart breaks.
We take the concept of diagram as code: version control, text based source - but we remove the syntax requirement. You can write “User connects to Database,” and we figure out the rest.
AI Diagram Maker: Your Go To Tool for Technical Visualizations
We are building this specifically for software engineers, tech leads, and architects. We aren’t trying to be a graphic design tool for marketers. We are a developer tool. Here is what that looks like in practice.
Beyond Simple Boxes: Generating Complex Flowcharts Instantly
Flowcharts are essential for mapping logic, but manual ones are tedious.
From Logic to Visual: Automating Process Flows
With our ai flowchart maker, you focus on the algorithm. You type: “Process starts. Check for API key. If valid, return 200. If invalid, return 401.”
We generate the nodes, the decision diamonds, and the routing lines instantly. You can even turn whiteboard sketches into editable diagrams using our vision model.
Real-World Example: Mapping a User Registration Process
Let’s say you are designing a signup flow. Instead of dragging shapes, you type this into our chat:
“Create a flowchart for user signup. Step 1: User enters email. Step 2: Validate format. If invalid, show error. If valid, check DB for duplicates. If duplicate, redirect to login. If new, create account and send verification email.”
In seconds, you have a professional Process Flow Diagram. You didn’t touch a mouse.
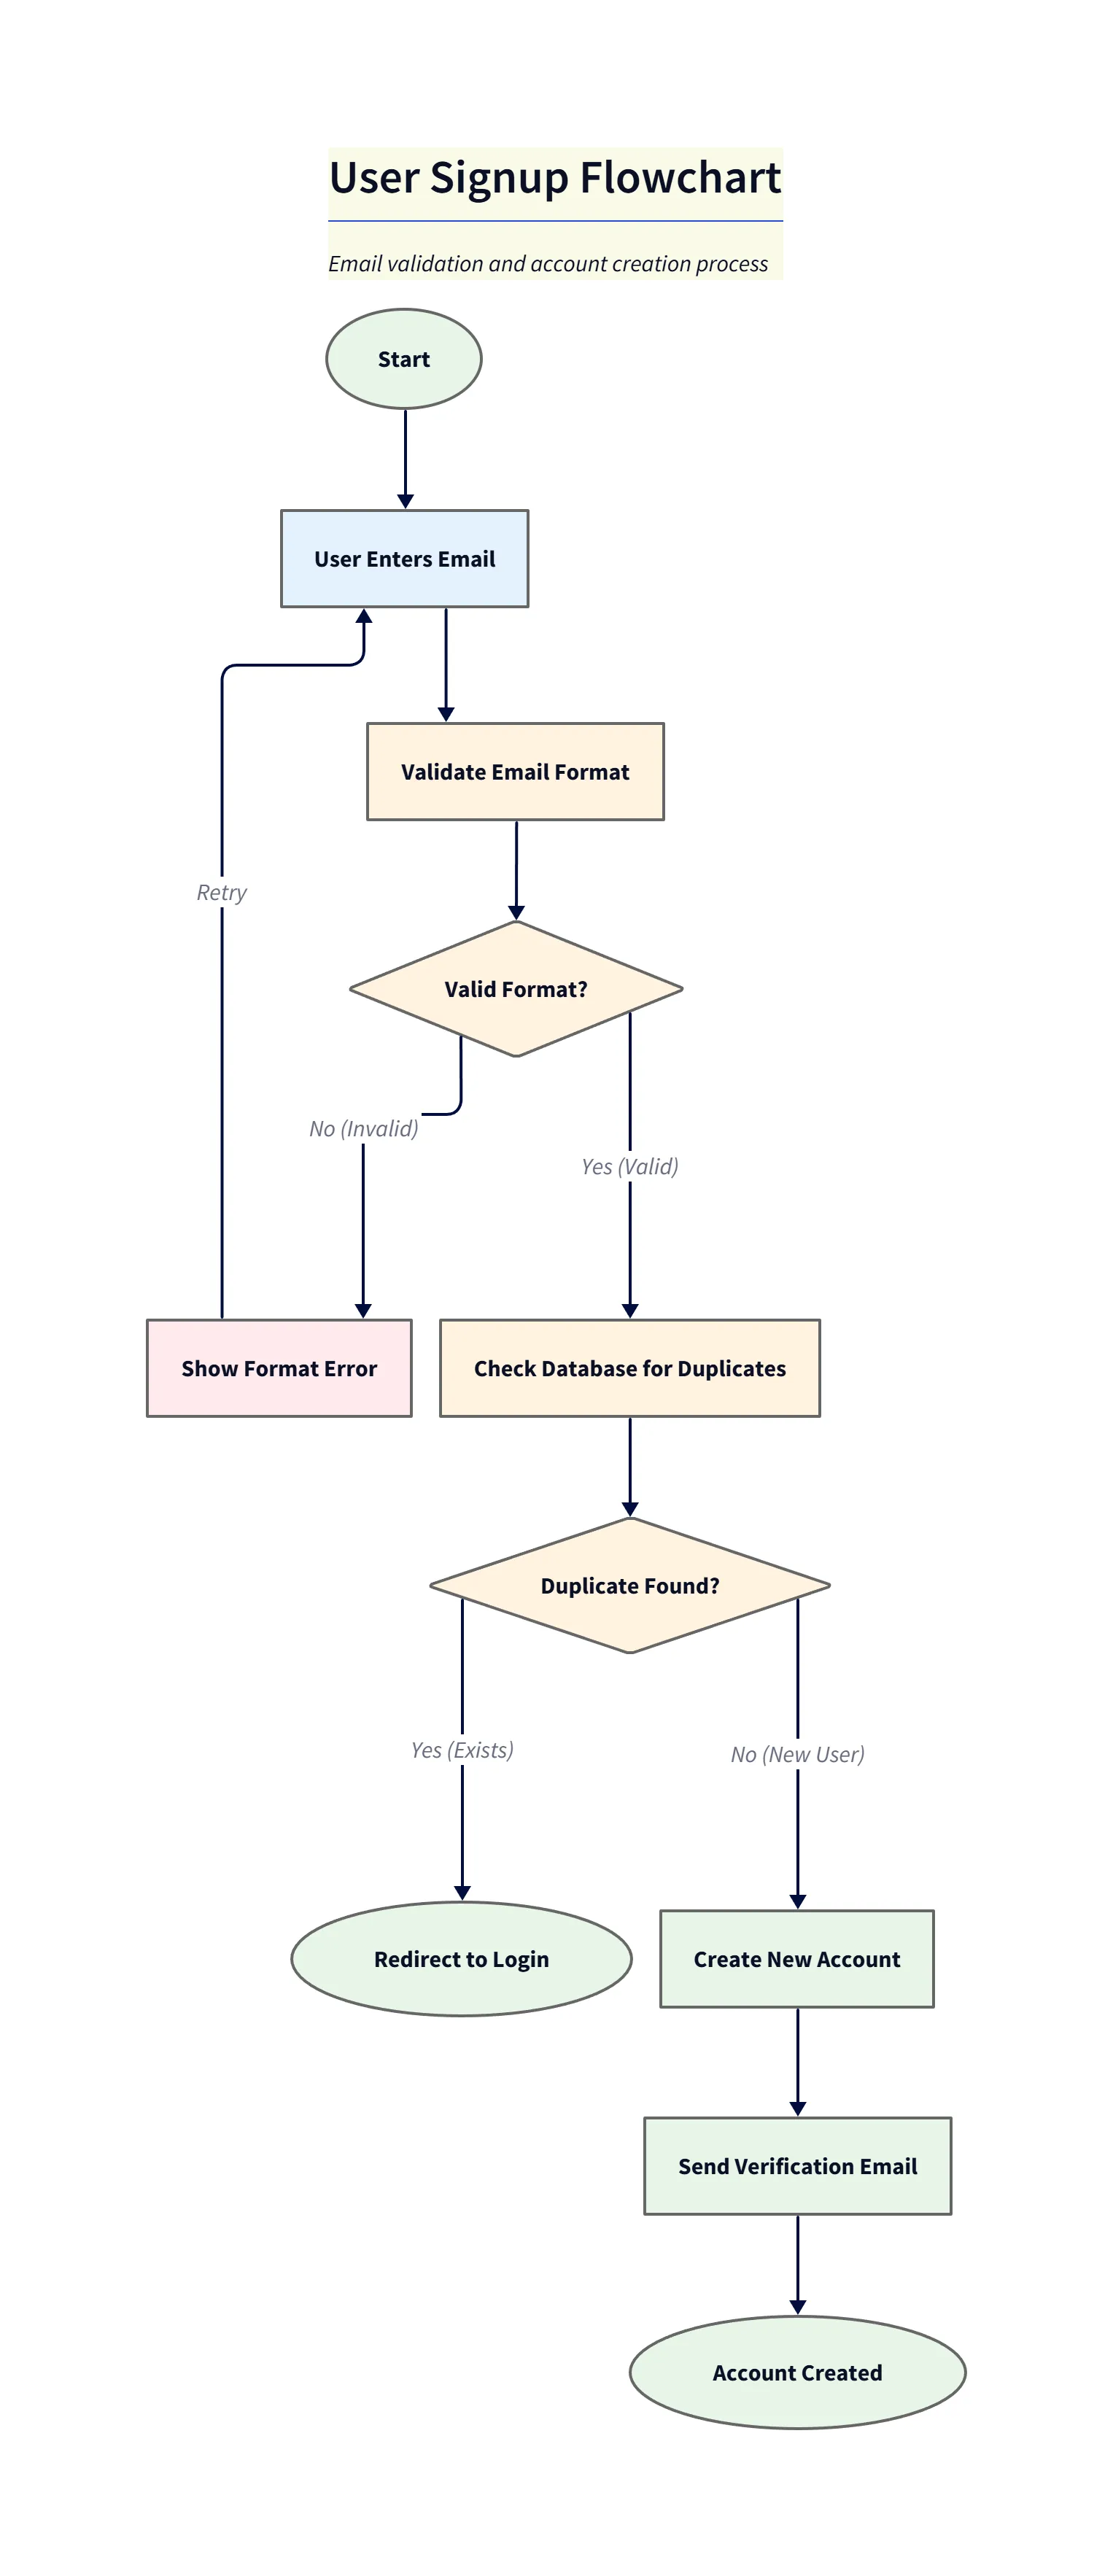
Diagram explanation:
- Start → Validation → Branching: The flow shows the initial input, a format validation decision, and branching for invalid vs valid inputs.
- Duplicate check & outcomes: Valid submissions proceed to a database duplicate check with explicit paths for redirect-to-login (duplicate) and create-account → send-verification (new user).
- Triage use: Useful as a quick reference for implementation and QA test-case generation.
Unveiling Database Structures: AI-Powered ER Diagram Generation
This is one of our most popular features for backend devs.
Demystifying SQL Schemas with Visual ERDs
We support importing SQL dumps directly. You can paste your schema file, and our ai er diagram generator parses the Primary Keys, Foreign Keys, and data types.
It automatically draws the relationships between tables to create a complete ERD. If you are working with a massive database, this is a lifesaver.
Practical Use Case: Reverse Engineering a Legacy Database
We have all been there. You inherit a legacy project. There is no documentation. Just a 5,000 line SQL file.
You can paste that file into AI Diagram Maker. Instantly, you see the visual structure of the data. You can see that users table connects to orders, which connects to order_items. Suddenly, the legacy code makes sense.
Mastering Object-Oriented Design with AI UML Diagrams
For the architects out there, we support UML Class Diagrams and Sequence Diagrams.
Crafting Class and Sequence Diagrams with AI
You can paste your Python or Java class definitions. We extract the methods, attributes, and inheritance structures to build an AI UML Class Diagram Generator. This is the best way of visualizing Python & Java classes without manual work.
For Sequence Diagrams, which are notoriously annoying to draw (all those lifelines and activation bars!), you can just describe the interaction: “Client sends request to Load Balancer. Load Balancer forwards to App Server. App Server queries DB.” You can even use our tool for generating sequence diagrams from code snippets.
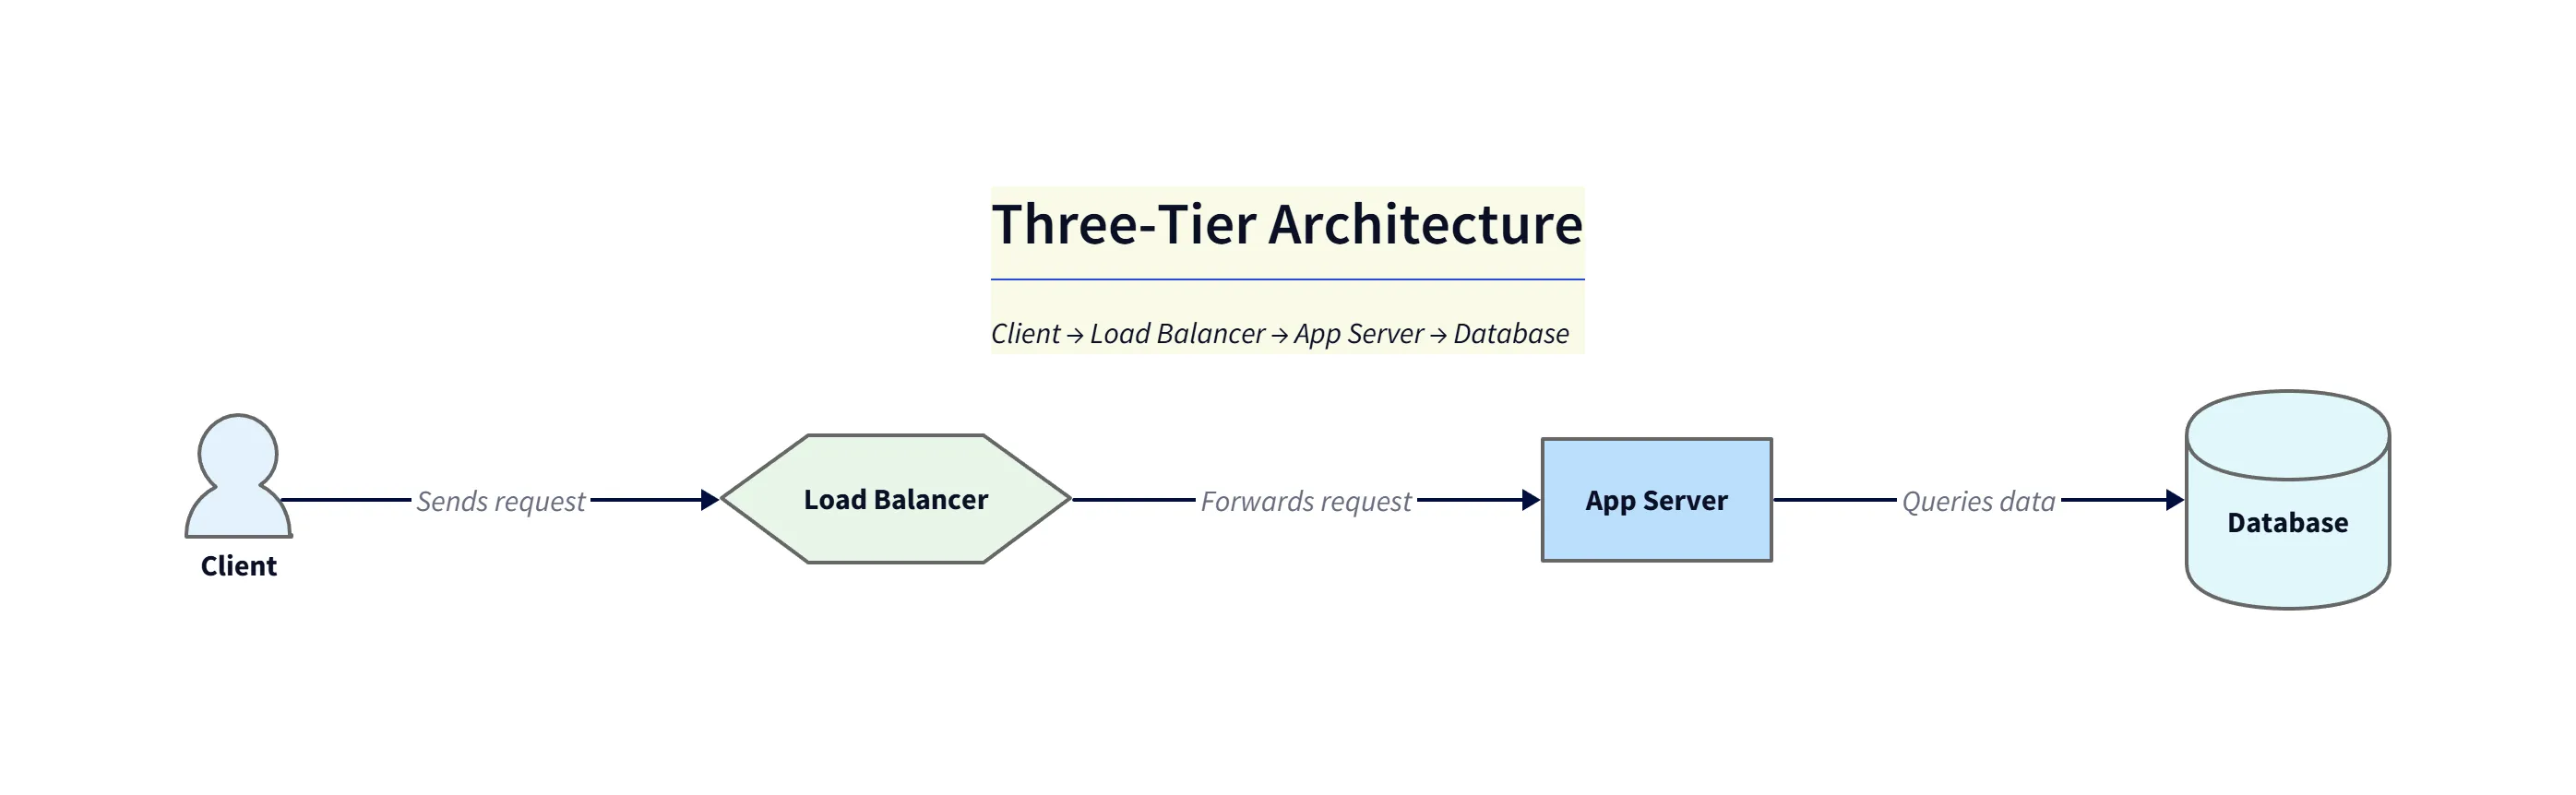
Diagram explanation:
- Lifelines & Messages: Shows
Client → Load Balancer → App Server → Databaseas a linear sequence with clear request and response arrows. - Where it’s helpful: Use this for simple request tracing, onboarding, and explaining synchronous call chains during architecture reviews.
Scenario: Onboarding Juniors with Auto-Generated Class Diagrams
Imagine onboarding a junior dev. Instead of walking them through file by file, you paste the core module code into our tool. You get a class diagram showing exactly how the PaymentGateway class inherits from the Service interface using Object-Oriented Design principles. It turns abstract code into a concrete map.
Visualizing System Architecture
We also support high level system architecture diagrams. You can describe your cloud stack like “AWS setup with EC2, connecting to RDS, behind a CloudFront CDN” and we visualize the infrastructure. It is perfect for including in your High Level Design (HLD) documents and managing your Infrastructure as Code. Even researchers find it useful for generating diagrams for academic papers.
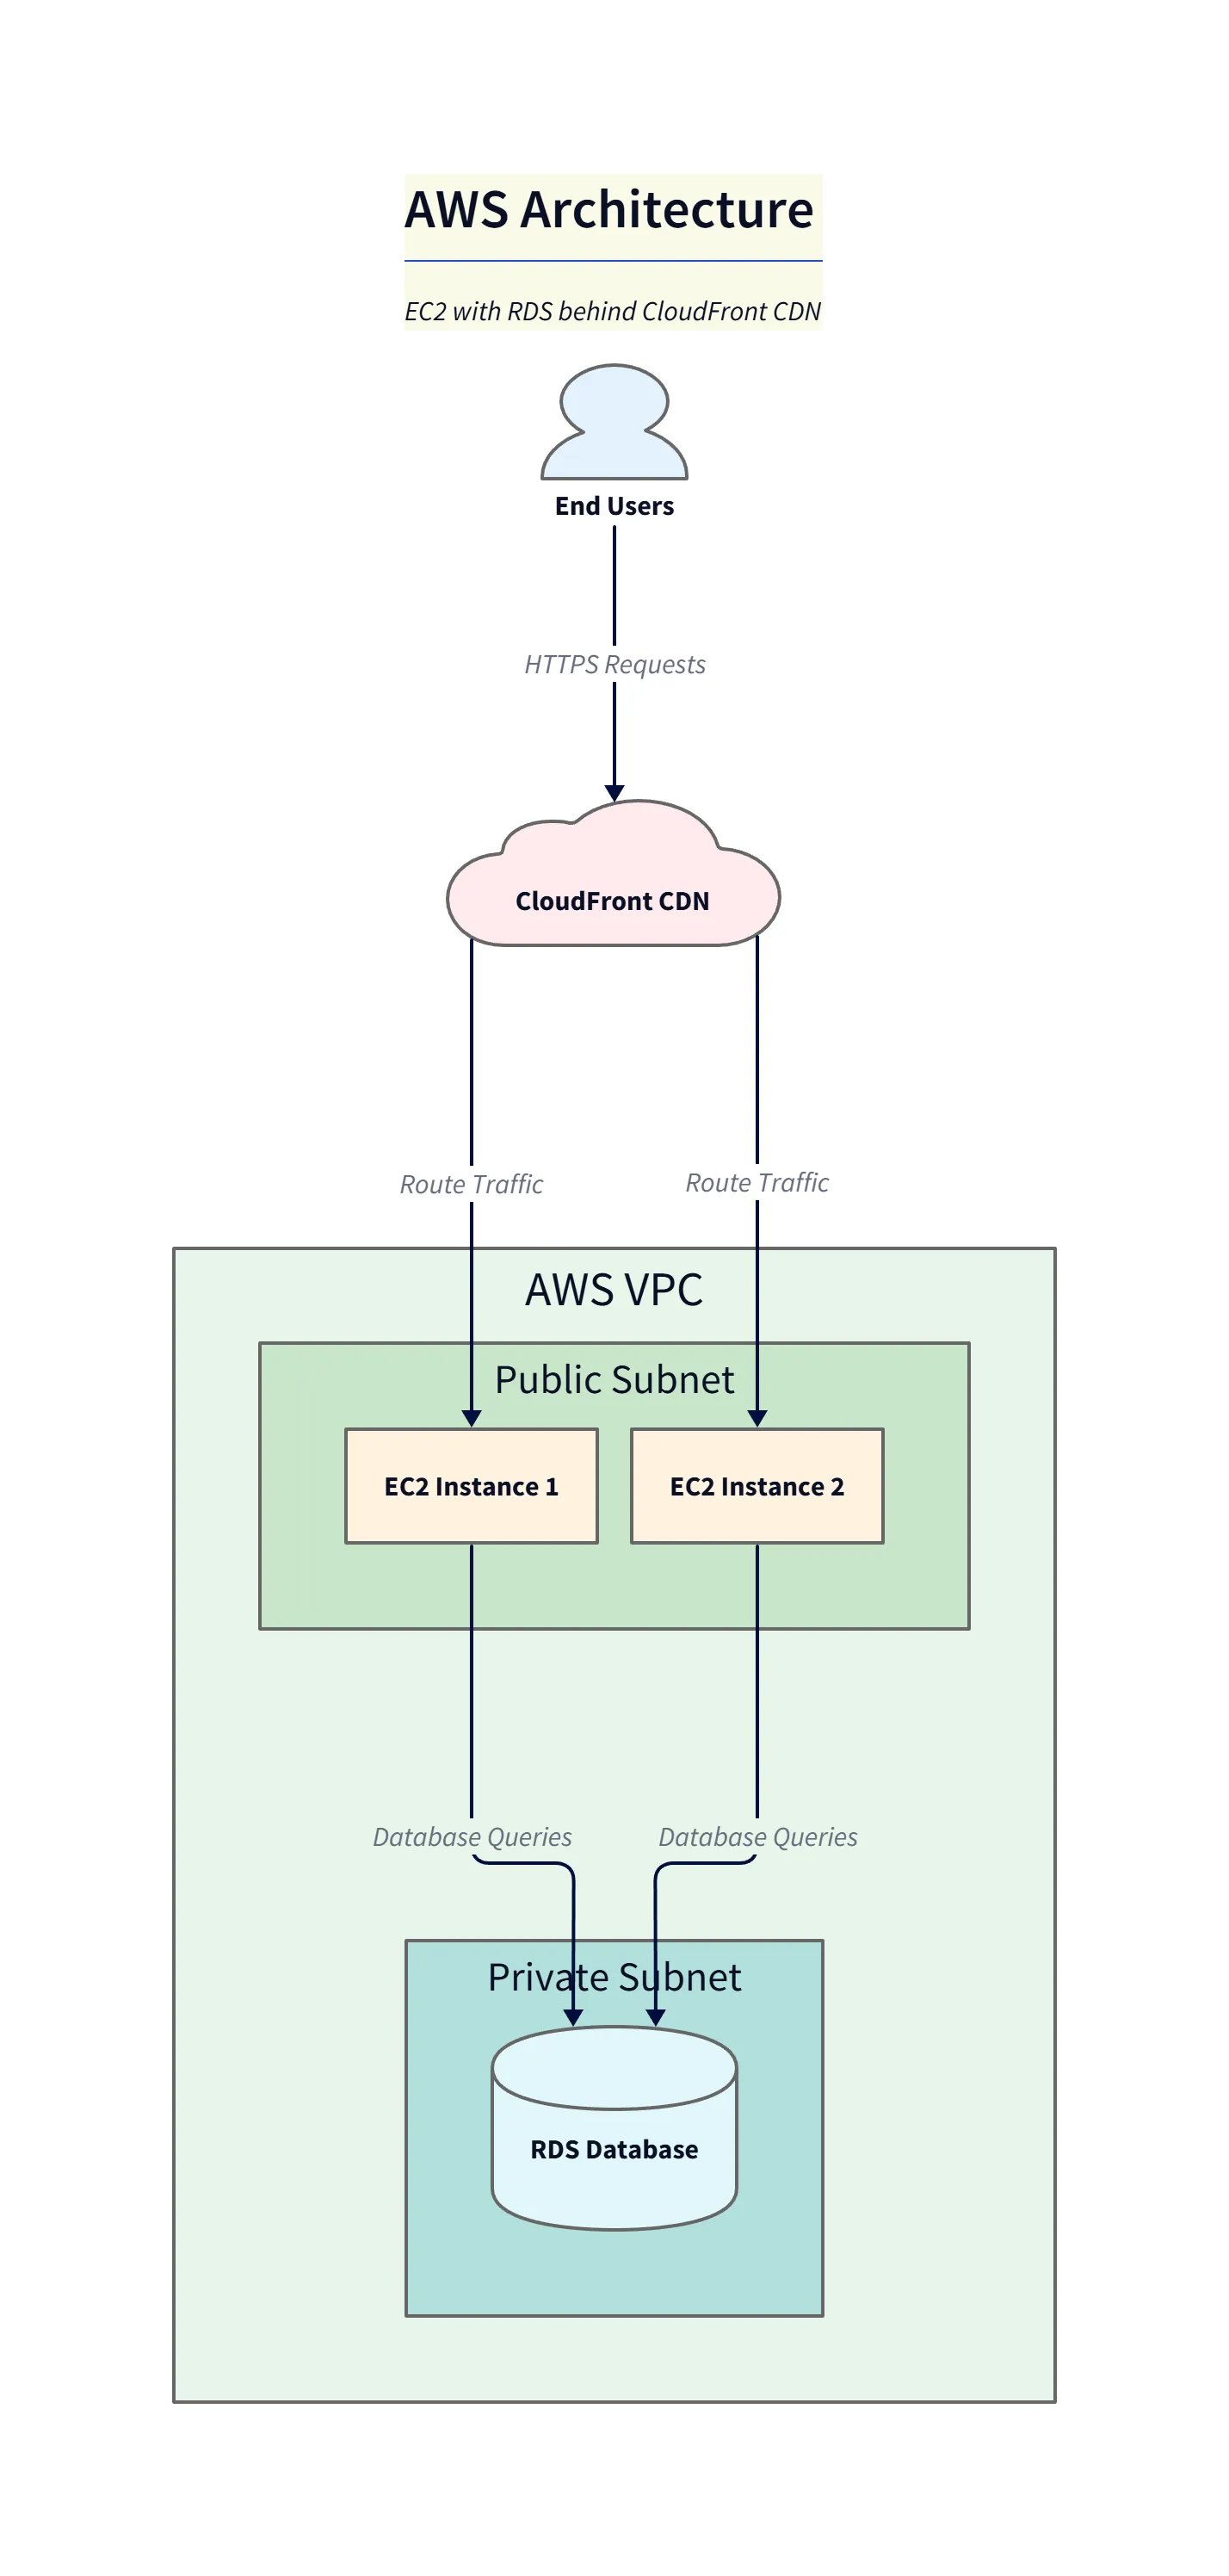
Diagram explanation:
- Edge & VPC layout:
CloudFrontsits at the edge, routing requests into theVPCwhere EC2 instances in public subnets handle traffic and private subnet hosts the RDS database. - Request & data flow: Arrows indicate HTTPS requests through the CDN to compute and database queries flowing to RDS; this HLD highlights network boundaries and data paths for security reviews.
- Presentation use: Ideal for HLD docs and stakeholder communication to show hosting topology and responsibilities.
Who Benefits Most from AI-Driven Technical Diagramming?
Software Developers
You want to code, not draw. We help you document your work in seconds so you can get back to your IDE.
Tech Leads & Architects
You need to communicate big ideas. Our tool helps you generate standardized, professional diagrams for your design docs and presentations without wasting an afternoon.
Solopreneurs & Founders
You are wearing ten hats. You don’t have time to fiddle with pixel alignment. You need to visualize your product architecture fast so you can build it.
Getting Started with AI Diagram Maker: Your No-Code/Low-Code Workflow
Step-by-Step: From Text Prompt to Technical Diagram
- Type or Paste: Enter a description, a user story, or paste your code.
- Generate: Our AI builds the structure.
- Refine via Chat: This is our secret sauce. You don’t drag boxes to fix mistakes. You just tell the chat: “Make the database node red,” or “Add a step between login and dashboard.”
Integrating with Your Codebase (Native GitHub Integration)
We are developers, so we know that if a tool doesn’t fit your workflow, you won’t use it.
That is why we allow you to export D2 code that you can version control. You can manually save diagram definitions to your repository (with automatic GitHub syncing coming soon). This allows you to manage your diagrams alongside your source code. It is true diagram as code management without the headache.
For users of VS Code, Cursor, or Windsurf, we fit right in. While we don’t have a plugin yet, the workflow is seamless: Copy your code snippet from Cursor, paste it into our tool, get the diagram, and then export the SVG back to your project folder.
The “Regenerate” Advantage: Keeping Diagrams Up-to-Date
When your code changes, you don’t have to redraw. You just update diagrams in seconds by pasting the new code snippet or SQL schema and generating a fresh diagram. We build the new visual to match the new reality. This keeps your documentation living and breathing, rather than rotting.
Common Misconceptions About AI Diagram Generators
“AI is only for simple diagrams” We handle complex ERDs with dozens of tables and intricate microservice sequences. In fact, the more complex the logic, the more time we save you.
“I’ll lose control over the design” You control the logic; we handle the aesthetics. But you can always override us using the chat refinement.
“It’s just another drawing tool” We are not a drawing tool. We are a documentation tool. The goal isn’t art; the goal is clarity and velocity.
Future-Proofing Your Documentation
We are just getting started. Our roadmap is packed with features requested by developers like you, including even deeper integrations with private repositories and “vibe coding” tools.
But for now, the goal is simple: Stop dragging boxes. Start generating ideas.