· Developer Tools · 9 min read
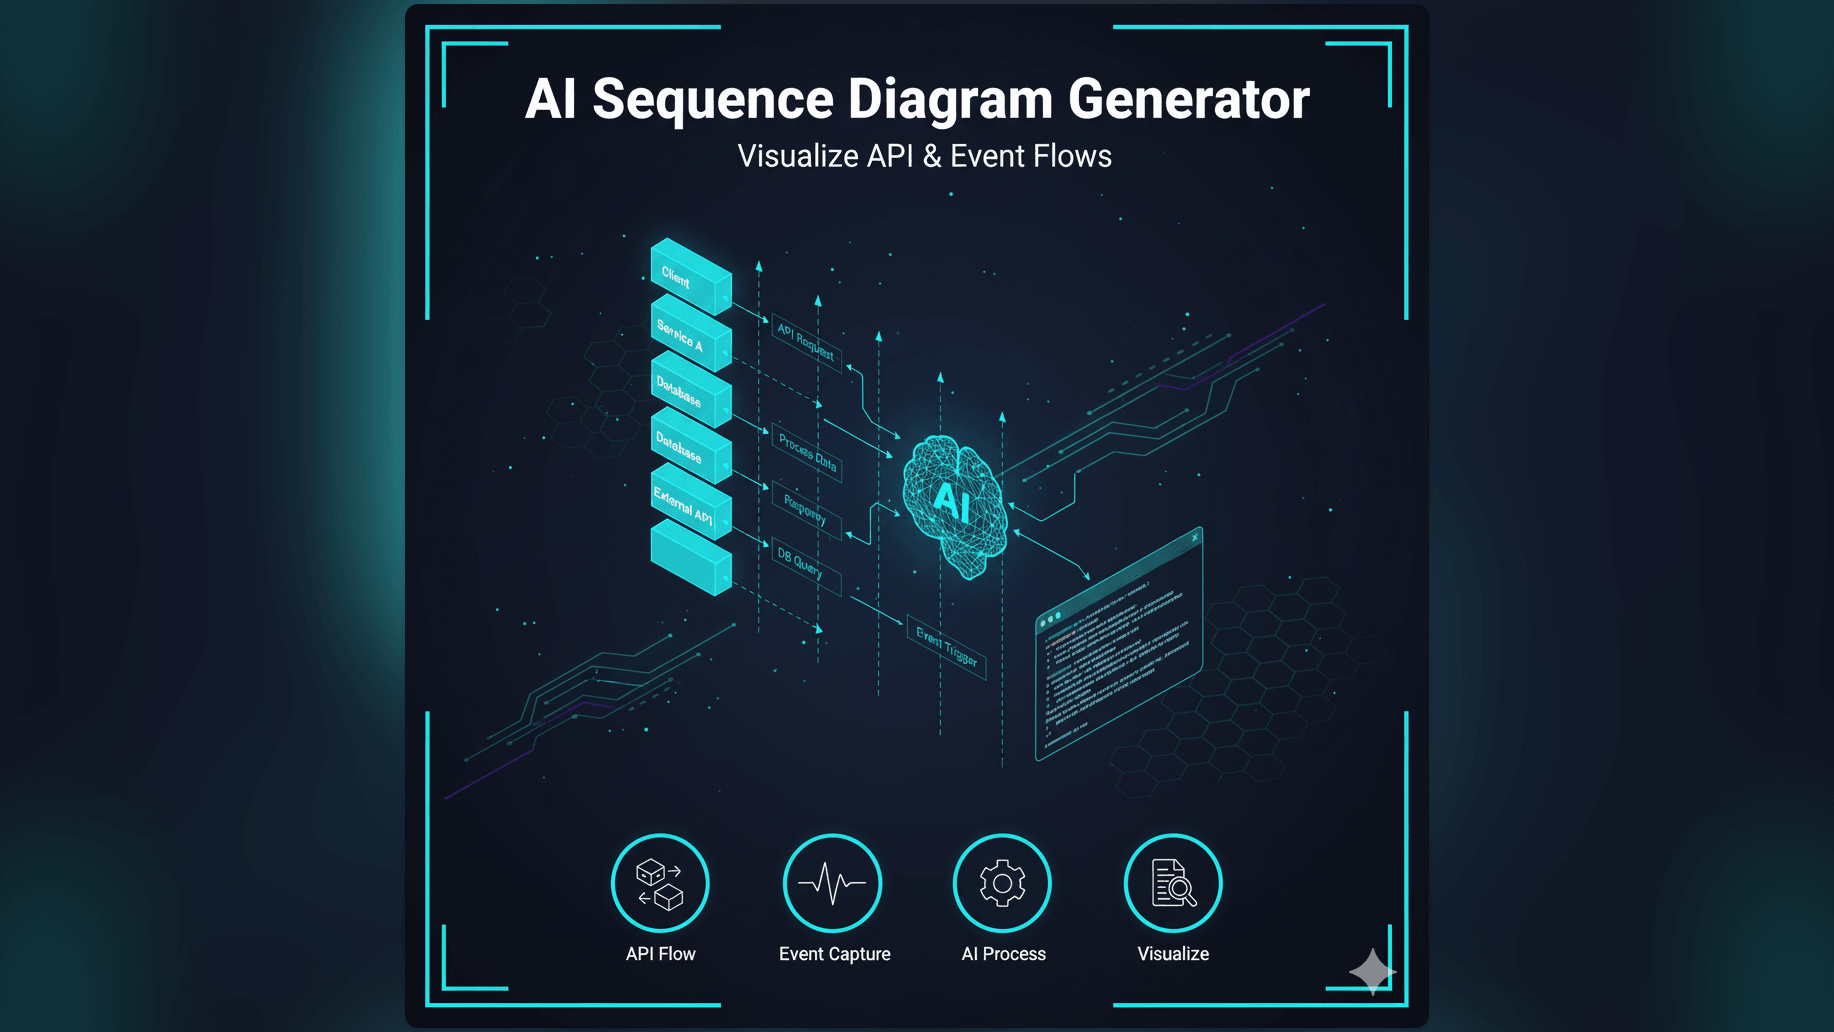
AI Sequence Diagram Generator: Visualize API & Event Flows
Stop manually drawing lifelines and activation bars. Learn how an AI sequence diagram generator transforms text descriptions into professional UML diagrams for microservices, API flows, and event-driven architectures.
If you have ever tried to debug a distributed system, you know it often feels less like engineering and more like being a detective in a murder mystery.
Something broke. You know the checkout failed. But why? Did the frontend send the wrong payload? Did the API gateway timeout? Did the payment service reject the card? Or did the database lock up while writing the transaction log?
You find yourself staring at five different terminal windows tailing logs from five different services. You are trying to build a mental map of who called whom and in what order. It is mentally exhausting.
This is exactly where a sequence diagram saves the day. It maps out the interactions over time. It shows the flow of messages between objects or services. But here is the catch: drawing them is awful.
Positioning the lifelines vertically. Drawing the arrows horizontally. Adding those little activation bars to show when a service is busy. If you realize you missed a step in the middle, you have to move everything down. It is tedious. It is slow. And honestly, most of us just don’t do it because the friction is too high.
We built our ai sequence diagram generator to remove that friction. We want you to have the clarity of a sequence diagram without the pain of drawing it.
The Challenge: Understanding Interacting Components in Complex Systems
Modern software is rarely a single monolith anymore. It is a collection of chatty components. You have microservices and serverless functions and third-party APIs and event buses.
Why Sequence Diagrams are Critical for Microservices and APIs
In this world, the “state” of the system isn’t just in a database. The state is in the messages flying back and forth. A sequence diagram is the only visual tool that captures the dimension of time.
It tells you the story of a request. It shows you that Service A called Service B which then waited for Service C. It highlights bottlenecks. It exposes circular dependencies. For an architect or a backend lead, this view is essential for correctness.
The Tedium of Manually Drawing Lifelines and Messages
However, the traditional tools for creating these diagrams are stuck in the past. They treat a sequence diagram like a drawing project.
You have to manually place the actors at the top. You have to draw a dashed line going down. This is called a lifeline. Then you draw an arrow. You label it “GET /users”. Then you draw a return arrow. You label it “200 OK”.
It takes forever. And it is brittle. If you decide that the Load Balancer needs to sit between the Client and the API, you have to drag everything around. It is pixel pushing, not engineering.
The Difficulty of Keeping Sequence Diagrams Up-to-Date with System Changes
Because creating them is so hard, we usually only do it once at the beginning of a project. We put it in the design doc and pat ourselves on the back.
Six months later, the code has changed. We added a caching layer. We switched to an async event queue. But the diagram in the wiki still shows a synchronous REST call. Now the documentation is lying to you. A new developer looks at it and assumes the system works one way when it actually works another. This leads to bugs and production outages.
Introducing AI Diagram Maker: Your Smart Text to Sequence Diagram Solution
We believe that the documentation should move as fast as the code. With AI Diagram Maker, you don’t draw: you describe.
You tell the AI what is happening and it generates the visualization. It handles the layout. It handles the spacing. It makes sure the lines are straight.
Describe Interactions, Get a Diagram: The Power of AI
The core of our tool is a text-to-visual engine. You can write in plain English or in a pseudo-code style.
“User sends a login request to the Auth Service. Auth Service validates credentials with the User DB. If valid, generate a JWT and return it to the User.”
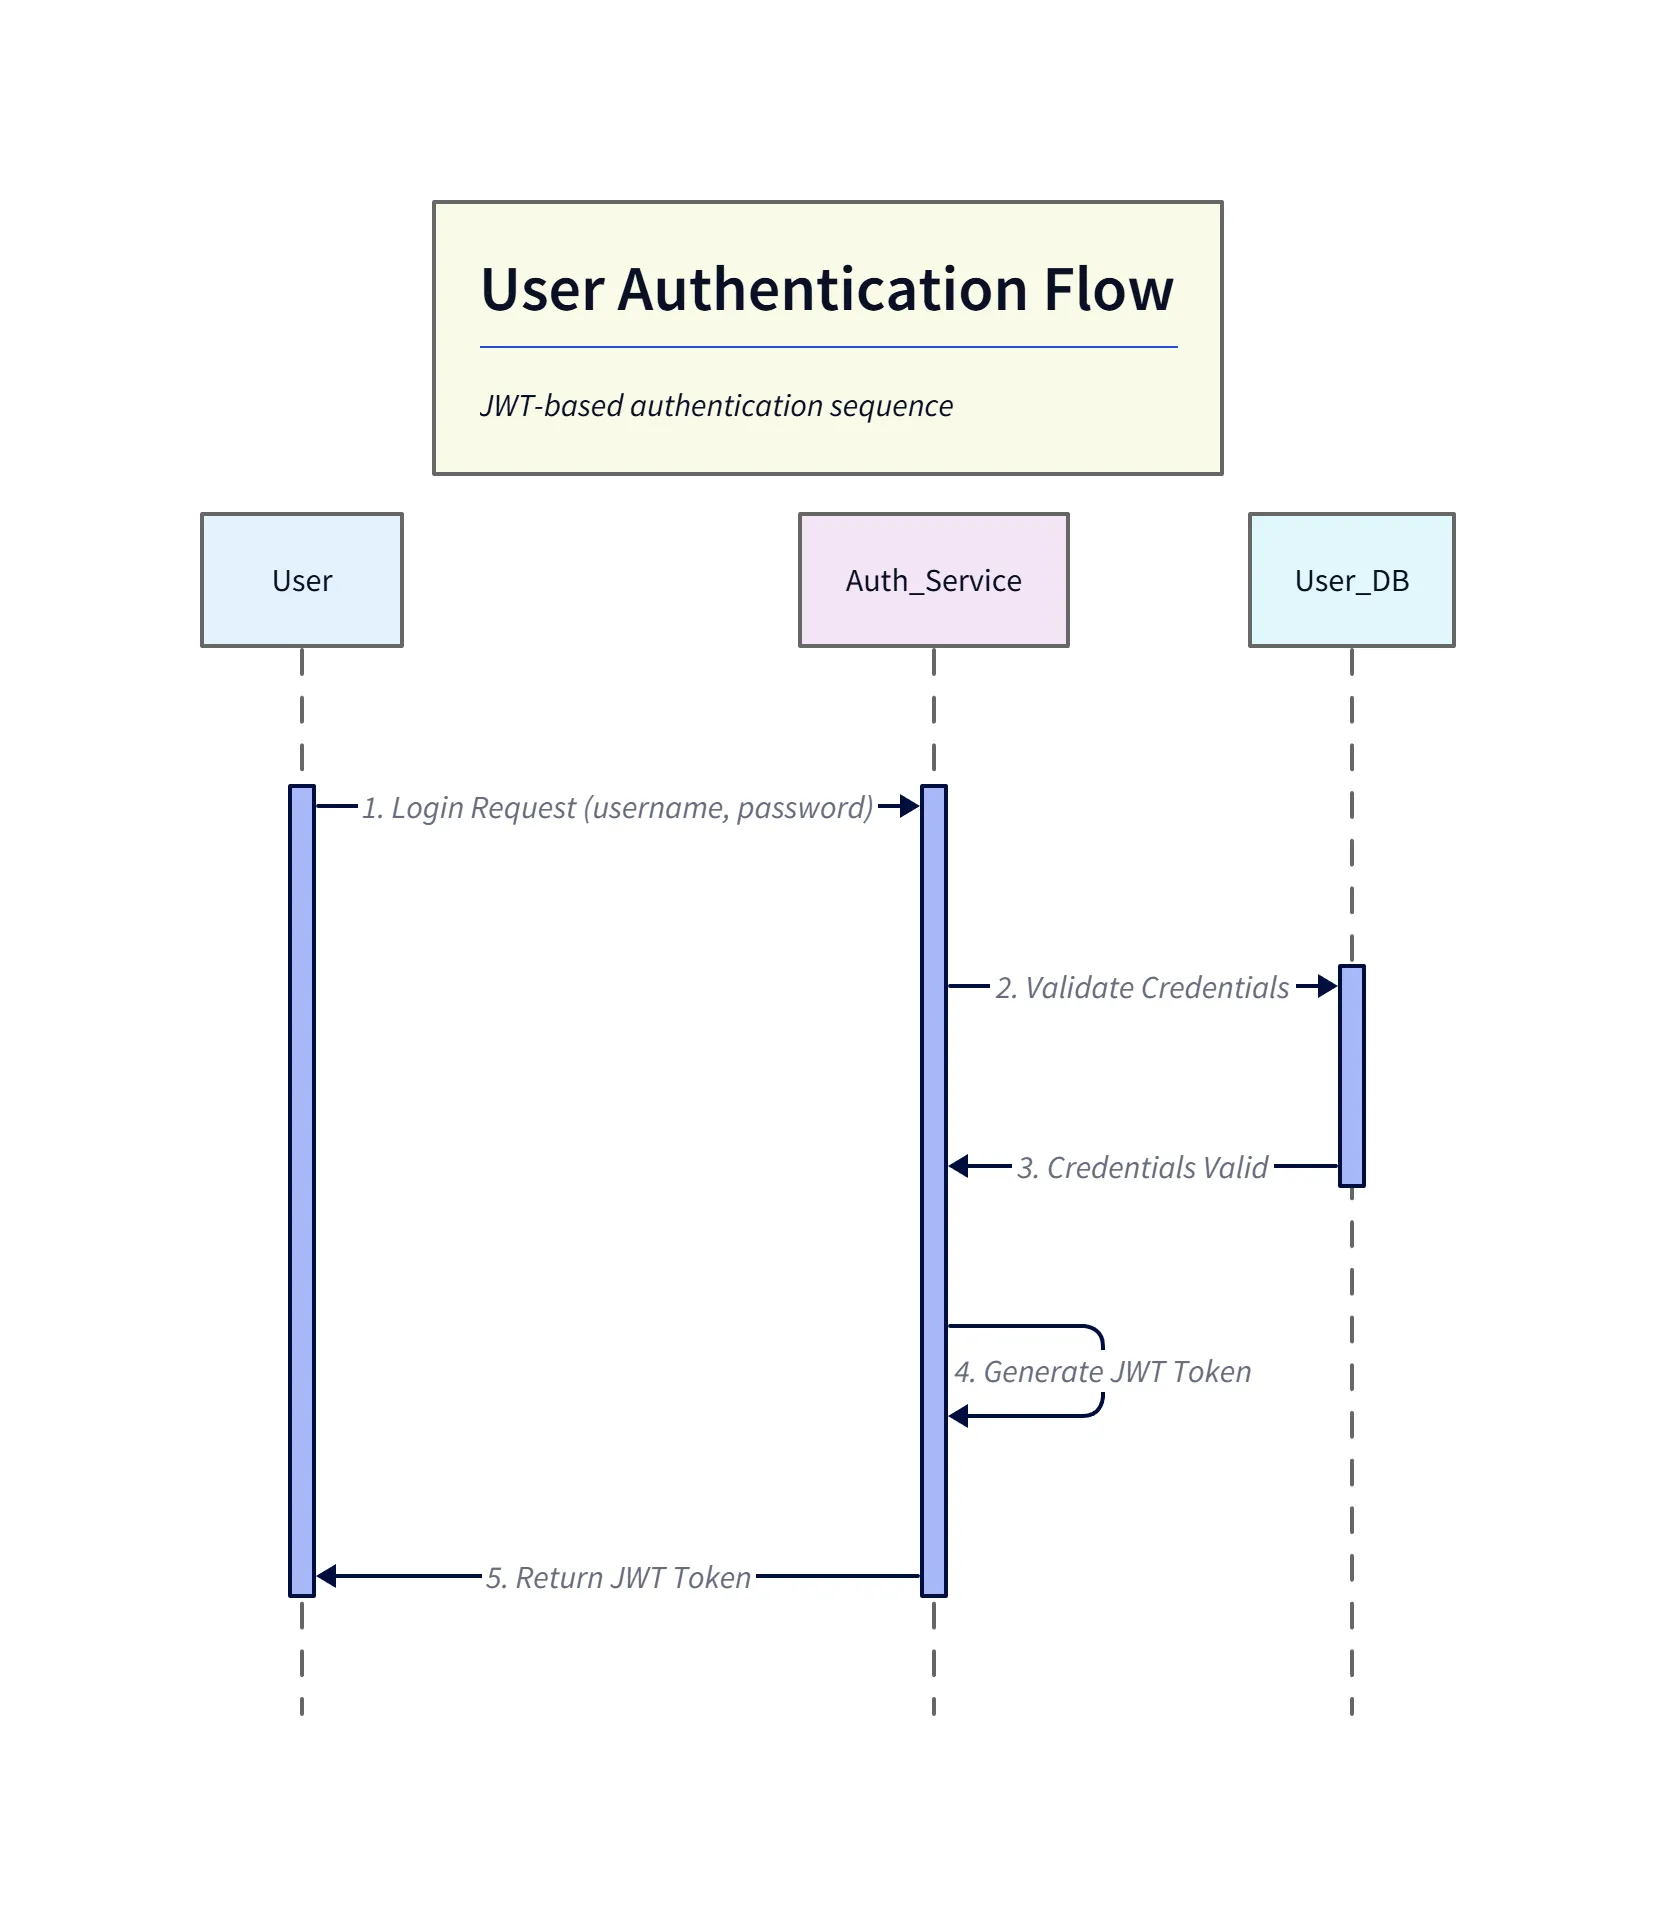
Diagram explanation:
- Participants:
User,Auth_Service, andUser_DBare shown as lifelines across the top. - Sync validation: The
Auth_Servicesends a synchronous validation request toUser_DB, receives confirmation, then generates the JWT. - Return path: A dashed return shows the token being returned to the
User— a clear happy-path depiction suitable for README examples.
Our AI reads that. It identifies “User” and “Auth Service” and “User DB” as the participants. It identifies the actions as the messages. It understands the “If/Else” logic and creates an alternative fragment (an alt block in UML terms). In seconds, you have a strictly formatted UML sequence diagram.
How Our AI Sequence Diagram Generator Transforms Text into Visuals
We have trained our models to understand the nuances of technical communication. We know that “posts a message” usually implies an asynchronous flow, while “requests data” usually implies a synchronous call.
We map these intents to the correct visual notation: solid lines for sync calls, open arrowheads for async messages, and dashed lines for return values. You don’t need to know the specific UML syntax. You just need to know how your system works.
Key Advantage: Chat-based refinement for Complex API Calls and Event Flows
The initial generation is usually great, but real systems are messy. Maybe you forgot to include the error handling path. In a manual tool, you would sigh and start dragging boxes. With us, you just use the chat.
“Add a step where the DB returns a timeout error.”
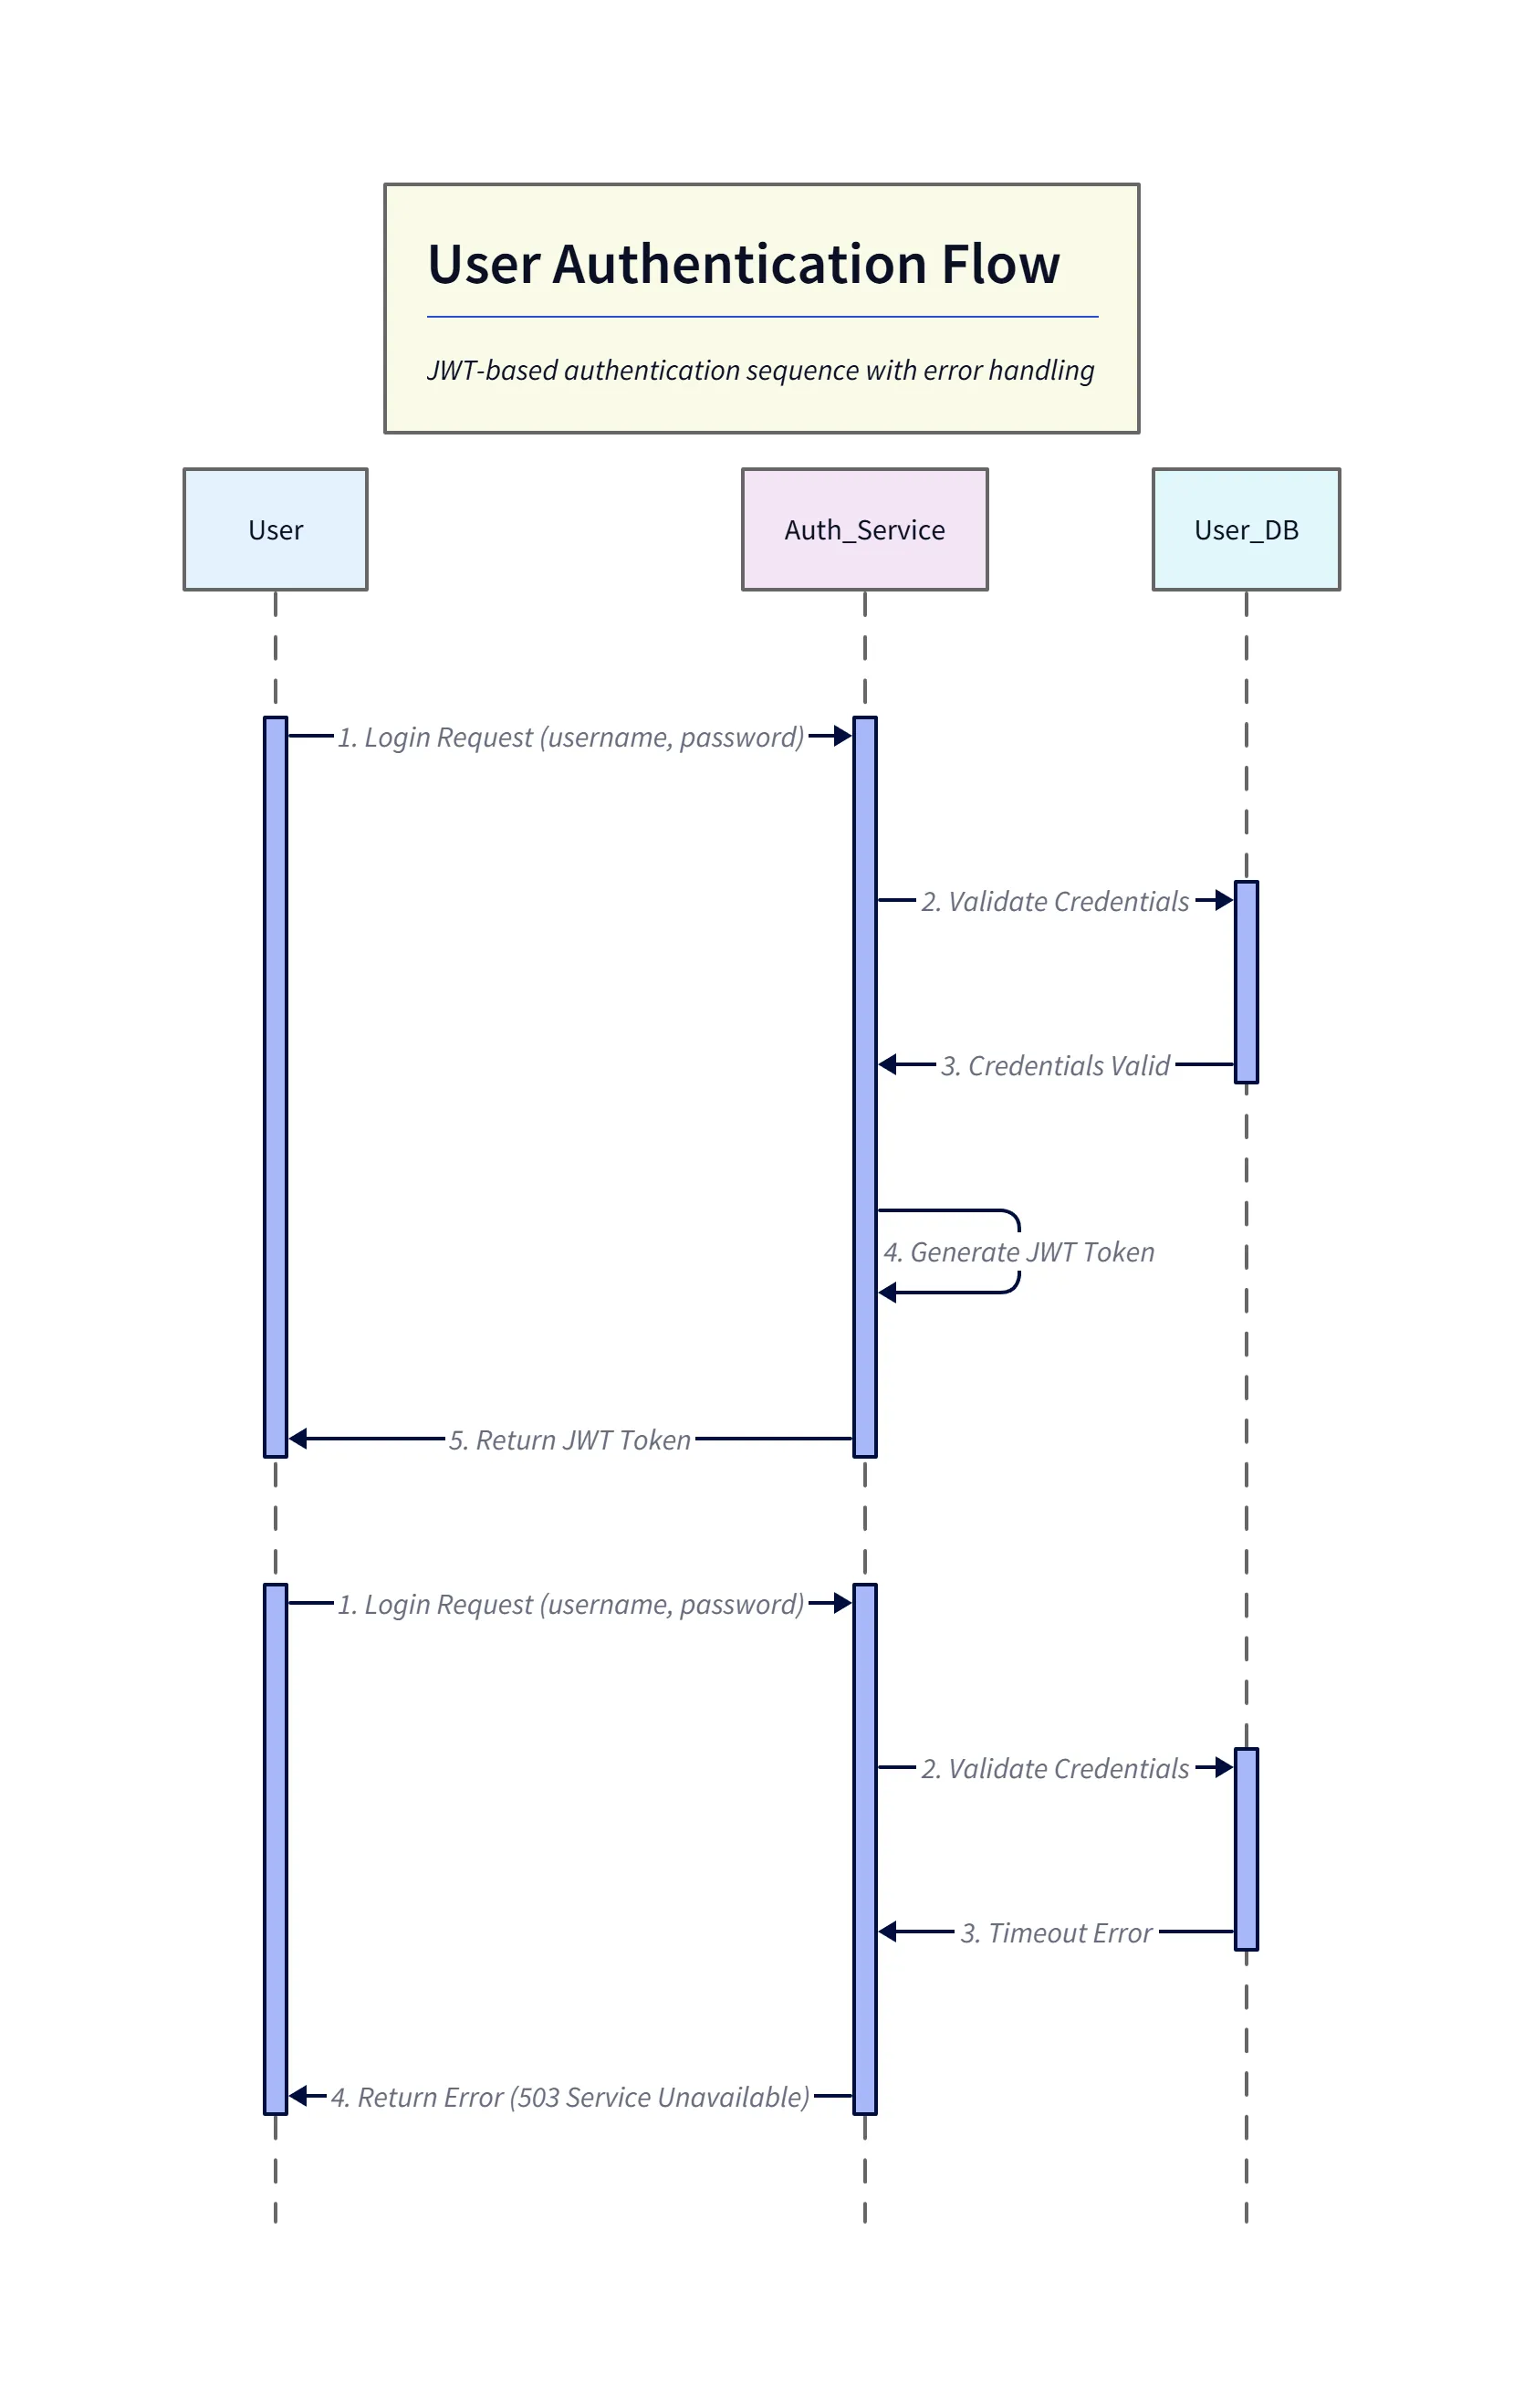
Diagram explanation:
- Error insertion: The diagram shows the DB timing out during credential validation, returning an error back to
Auth_Service. - Failure handling: The
Auth_Servicethen returns a503 Service Unavailable(or similar) to theUser, making the failure mode explicit for debugging and postmortem documentation. - Layout update: The AI-adjusted layout places the error flow under the original sequence while preserving lifeline alignment for easy comparison with the happy path.
The AI understands context. It inserts that error flow into the existing diagram and adjusts the vertical spacing automatically. This conversational iteration allows you to refine the logic rapidly until it matches reality perfectly.
Essential Use Cases for AI-Generated Sequence Diagrams
We see developers using this tool every day to clarify the most complex parts of their stack.
Documenting Microservice Communication Patterns
When you are breaking a monolith into microservices, visualizing the boundaries is key. You can use AI Diagram Maker to map out exactly how the new “Order Service” talks to the “Inventory Service.” It makes the decoupling process safer because you can see the dependencies clearly.
Tracing User Authentication Flows Across Systems
Authentication is famously hard to get right. You have OAuth2 flows with redirects and tokens and callbacks. It is a spaghetti of interactions. Describing this textually helps you audit the security. “Client sends code. Server exchanges code for token.” Seeing it visually confirms that you aren’t accidentally exposing secrets in the wrong step.
Visualizing Asynchronous Event-Driven Architectures
Event-driven systems are hard to debug because things happen in parallel. Service A publishes an event and forgets about it. Service B picks it up later. You can describe this to the AI: “Order Service publishes ‘OrderCreated’ event to Kafka. Email Service consumes ‘OrderCreated’. Fulfillment Service consumes ‘OrderCreated’.”
The resulting diagram shows the parallel consumption clearly, helping you reason about eventual consistency.
Debugging Inter-System Communication Issues
This is perhaps the most valuable use case. When production breaks, you can use the tool to “reconstruct the crime scene.”
We explore this deeply in our scenario guide. You can take the logs or your hypothesis of what went wrong and generate a diagram. “Client sent request. Load Balancer forwarded it. Server crashed.” Seeing the failure point visually often triggers the “Aha!” moment that solves the bug.
Manual Sequence Diagramming vs. AI: A Leap in Efficiency
Let’s compare the two workflows side by side.
The Traditional Process: Mapping Actors, Lifelines, and Messages by Hand
- Open tool. Wait for it to load.
- Drag “Actor” shape. Name it “User”.
- Drag “Object” shape. Name it “API”.
- Align them.
- Draw a line from User to API.
- Double click the line. Type “POST /login”.
- Draw a dashed line back.
- Realize you need a Database in the middle.
- Select API and move it right.
- Drag new Object “DB”.
- Re-align arrows.
Total time: 15 minutes. Frustration level: High.
The AI-Powered Approach: Generating Comprehensive Diagrams from Text
- Type: “User posts login to API. API queries DB. DB returns user. API returns token.”
- Press Enter.
Total time: 20 seconds. Frustration level: Zero.
Effortless Updates: Adapting to Changes with a Simple Prompt Adjustment
When the API changes to verify 2FA, you just add a sentence to your prompt: “API checks 2FA status.” The AI redraws the whole thing. Your documentation stays fresh because updating it takes seconds, not hours.
Step-by-Step: Creating Your Sequence Diagram with AI Diagram Maker
Here is how you can build your first diagram today.
Defining Actors and Messages in Natural Language
Start with a clear mental model. Who are the participants? What are they saying to each other? Type it into the input box. You can use shorthand: “A calls B. B calls C. C replies to B.” The AI is smart enough to figure out that A, B, and C are the participants.
Leveraging AI for Initial Diagram Generation
Hit generate. The AI parses your text, looks for the subject-verb-object patterns, and constructs the UML model. You will see a clean, professional sequence diagram appear.
Using Chat-based Refinement for Specific Details and Edge Cases
Now look closely. Is it accurate? Maybe you want to show a loop. Type: “Wrap the database calls in a loop that retries 3 times.” Or maybe you want to group participants: “Put the API and DB in a box called ‘Backend’.”
The chat interface allows you to sculpt the diagram. You are the director giving instructions, and the AI is the camera crew making it happen.
Exporting and Integrating into Documentation
Once it is perfect, export it. We support SVG exports which are perfect for embedding in your README or internal wiki. You can also export the D2 code and save the diagram source directly to your repo. This is the holy grail of documentation: visuals that are version-controlled alongside the code they describe.
This guide explains more about the broader developer workflow, but for sequence diagrams specifically, the value is clear. You stop fighting the drawing tool and start understanding your system.