· Developer Tools · 4 min read
Why Developers Prefer D2 Over Drag-and-Drop Tools
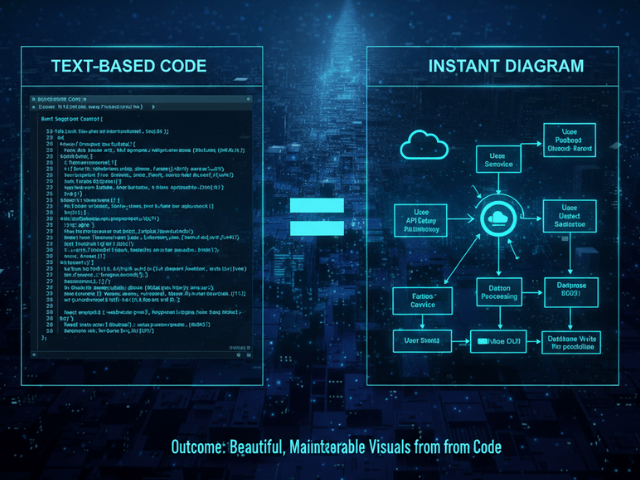
This guide explores the battle of D2 vs. Lucidchart and why developers are increasingly choosing text-based tools for their technical documentation, focusing on the advantages of declarative diagramming.
There is a divide in the engineering world. On one side, you have the “Visual Thinkers.” They love whiteboards. They love infinite canvases. They love dragging perfectly rounded rectangles onto a grid. On the other side, you have the “Text Thinkers.” They love Vim. They love Markdown. They believe that if it cannot be committed to Git, it is not real.
For a long time, diagramming belonged to the Visual Thinkers. Tools like Lucidchart and Visio dominated. But recently, a new player has entered the chat: D2 (Declarative Diagramming).
This guide explores the battle of D2 vs. Lucidchart and why developers are increasingly choosing text-based tools for their technical documentation.
The Battle: Declarative vs. Imperative Diagramming
To understand the shift, you have to understand the difference in philosophy.
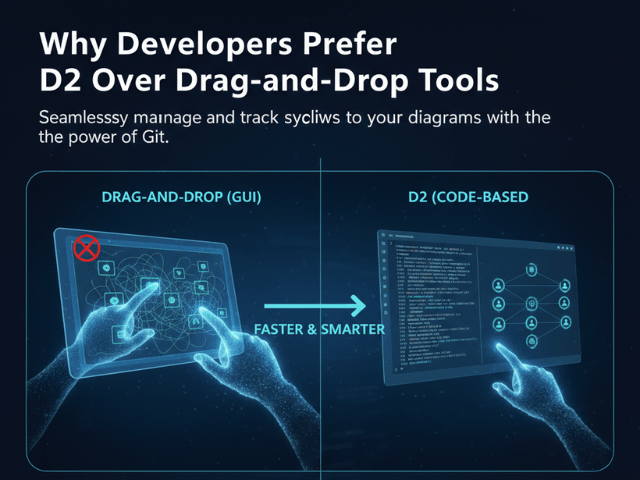
Drag-and-Drop (Imperative): “Move pixel here”
Traditional GUI tools are Imperative. You have to tell the computer exactly how to draw the diagram. “Draw a box at coordinate 100,200. Make it 50 pixels wide. Draw a line from 100,200 to 300,400.” You are micromanaging the layout. This gives you total control, but it also gives you total responsibility. If you add a new box, you have to manually move all the other boxes to make room.
D2 (Declarative): “Connect A to B”
D2 is Declarative. You tell the computer what you want, not how to draw it. “Connect User to Server.” The layout engine figures out the rest. It decides where to put the User. It decides the path of the arrow. It handles the collision detection. You surrender control of the pixels to gain speed and maintainability.
The Key Advantages of D2
Why are developers switching? It comes down to workflow.
Git-Friendly (Diffable Text)
We have said it before, but it is the killer feature. D2 files are just text. When you change a diagram, you can see the change in your Pull Request.
- User -> Database
- User -> Cache -> Database
You can review that diff. You can comment on it. You can merge it. You cannot do that with a binary file from a GUI tool.
Auto-Layout Engine (No more aligning pixels)
Developers are perfectionists. If we use a GUI tool, we will waste hours trying to get the arrows perfectly straight. D2 removes that temptation. The engine handles the alignment. It ensures consistent spacing. It produces a diagram that looks “correct” every single time without any manual fiddling.
Programmability and Scripting
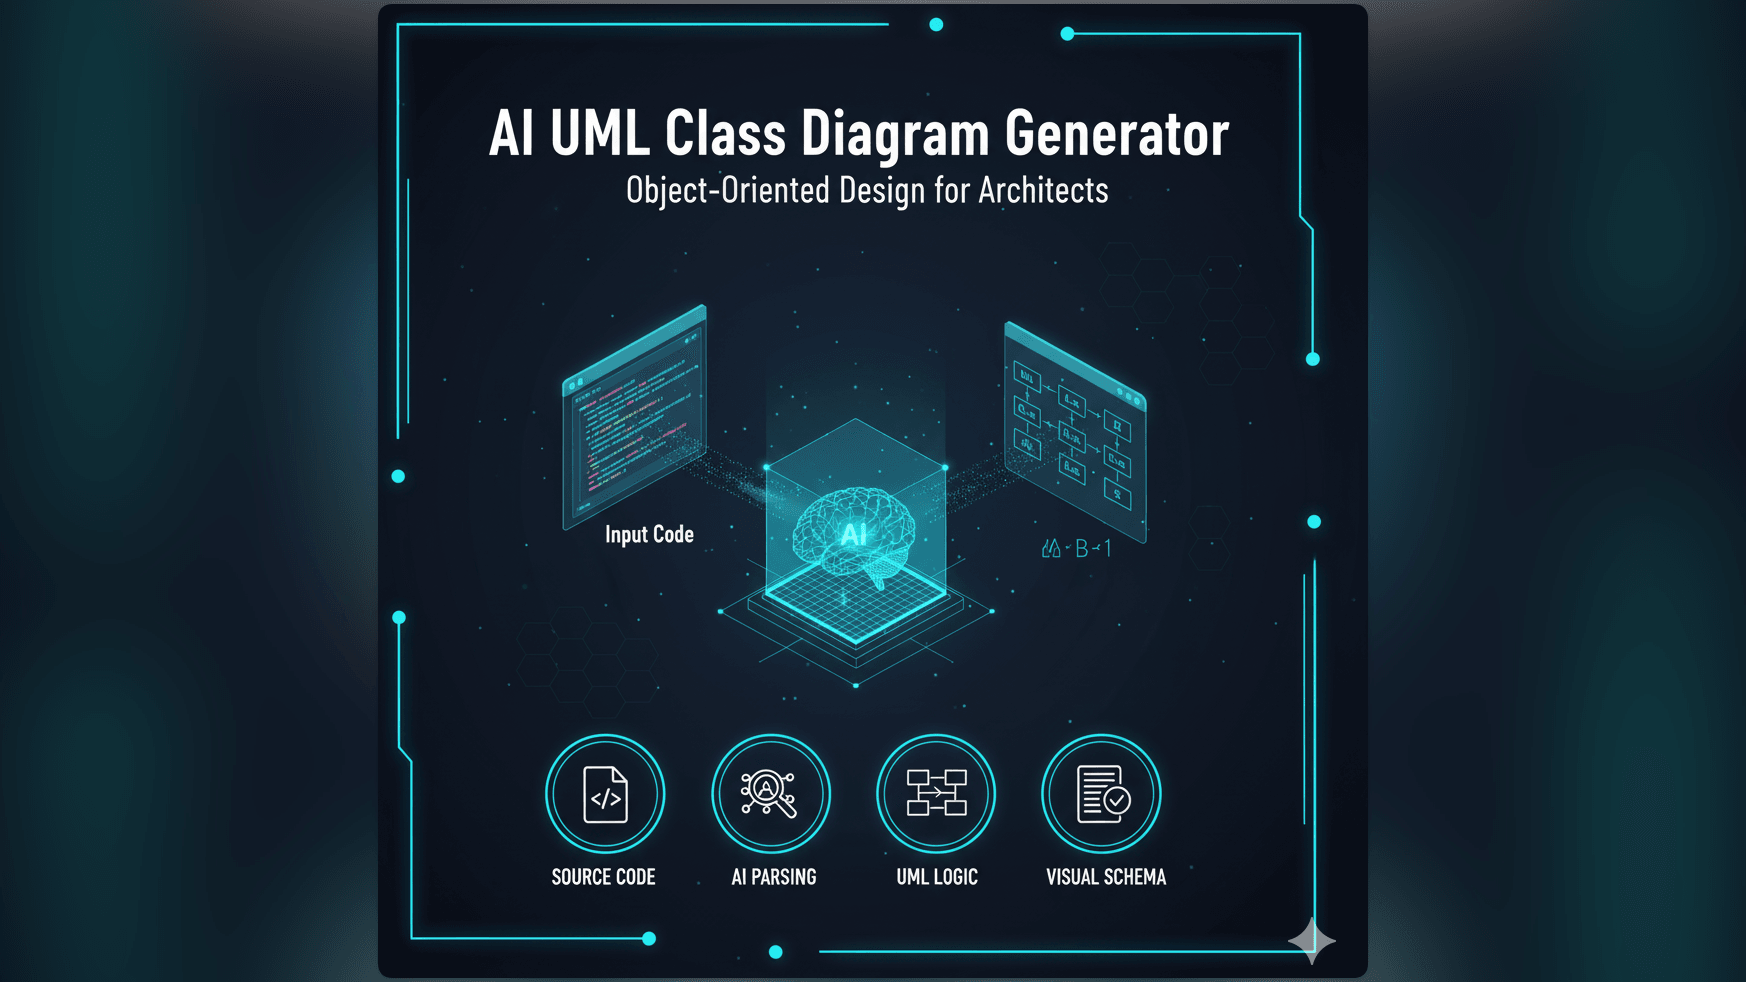
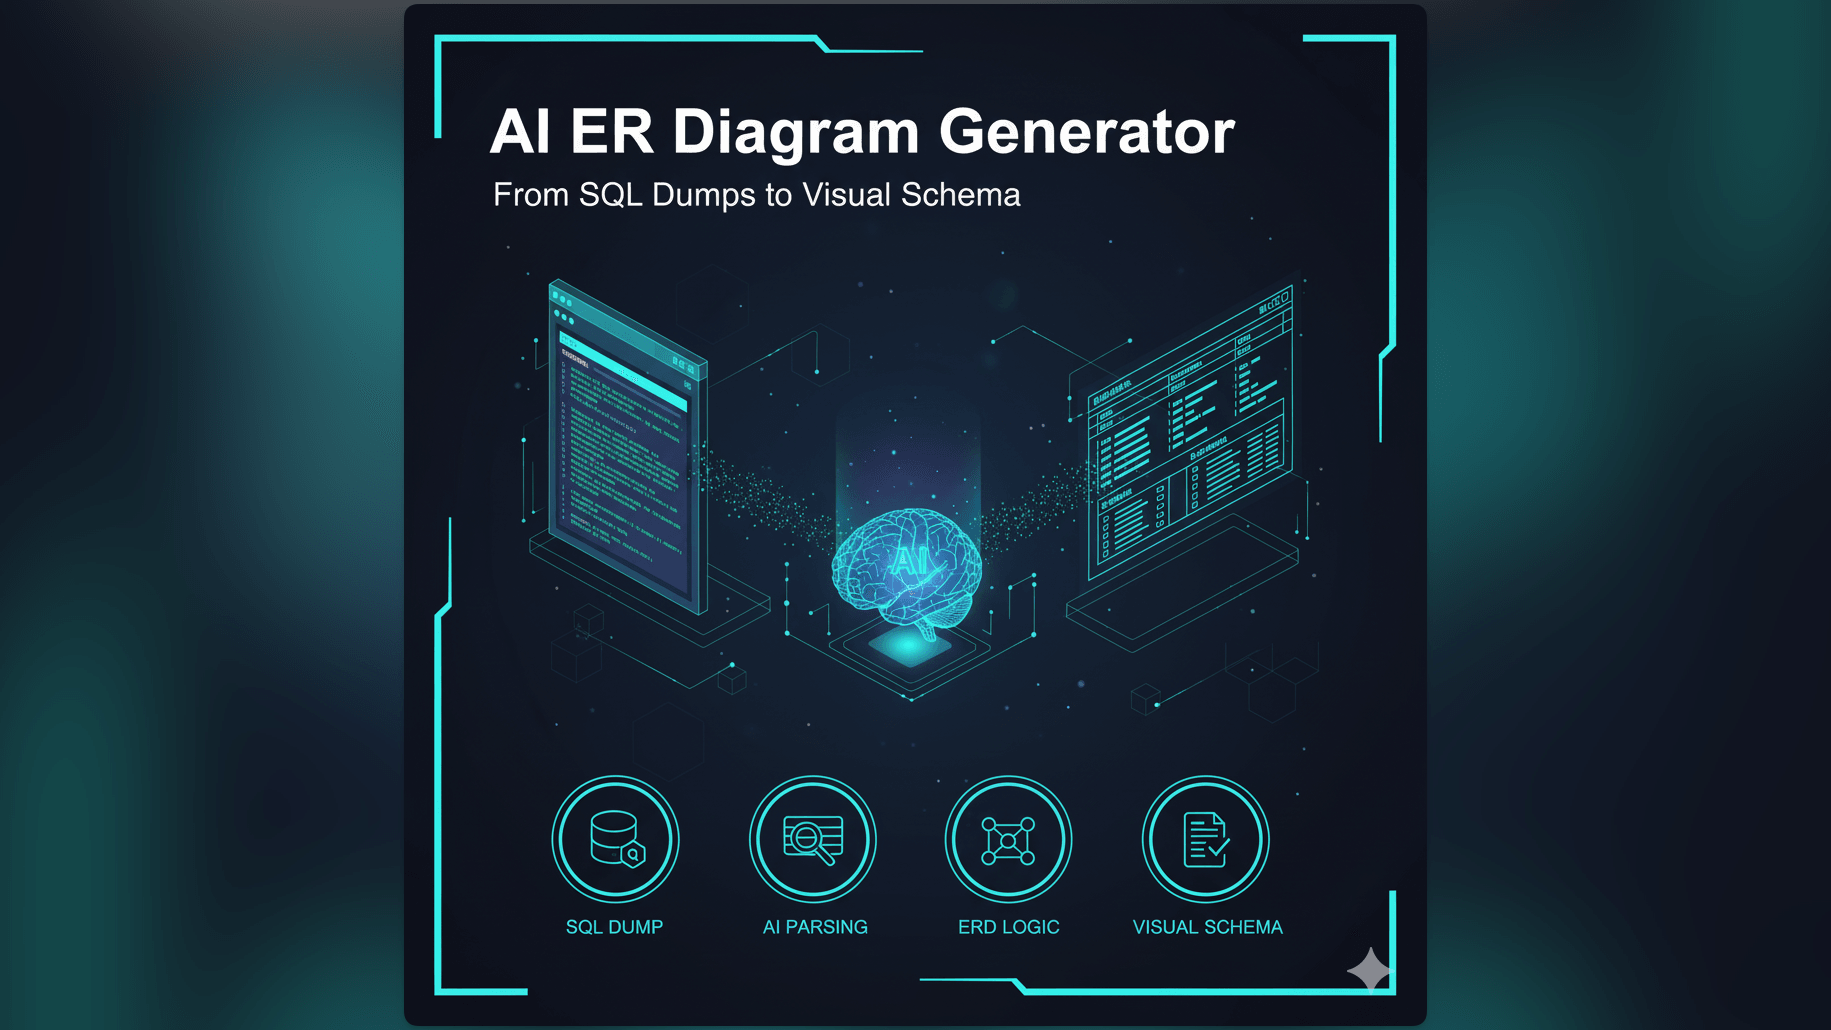
Because D2 is code, you can generate it. You can write a Python script that scans your AWS infrastructure and outputs a D2 file. You can write a script that parses your database schema and generates an ERD. This unlocks “Diagrams as Code” at scale. You can automate your documentation pipeline.
How AI Diagram Maker Bridges the Gap
D2 is amazing, but learning a new syntax is still a barrier.
Generating D2 Without Learning the Syntax
We built AI Diagram Maker to solve that “blank page” problem. You do not need to read the D2 documentation. You just tell our AI “Map a user login flow.” Our AI writes the D2 code for you. You get the benefits of the powerful layout engine and the text-based output without having to learn the keywords.
Getting the Power of D2 with the Ease of Natural Language
It is the best of both worlds. You interact with natural language. The system outputs structured code. You can then export that D2 code and put it in your repo. You have “ejected” from our tool. You own the source.
When to Use Lucidchart vs. AI Diagram Maker
We are not saying GUI tools are dead. They have their place.
Use GUI for Brainstorming/Design
If you are in a meeting and you just want to throw ideas around, a whiteboard tool is superior. The freedom to draw messy lines and scribble notes is valuable for creativity. Use Lucidchart or Miro for the “messy middle” of design.
Use Text/AI for Engineering Documentation
But once the design is settled, switch to text. Use AI Diagram Maker and D2 for the permanent record. Use it for the README. Use it for the architectural decision record. Text-based diagrams are resilient. They survive refactors. They survive team changes. They are the professional choice for long-term engineering health.
The Programmable Diagram: A Developer’s Guide to D2 and Text-Based Visuals
Dive deeper into the world of text-based diagramming and discover why it is the future of developer documentation in our comprehensive guide: The Programmable Diagram: A Developer’s Guide to D2 and Text-Based Visuals.
SVG vs. PNG: Why Vector Graphics Matter for Technical Docs
Understanding the advantages of vector graphics is crucial for technical documentation. Learn more about it here: SVG vs. PNG: Why Vector Graphics Matter for Technical Docs.