· Developer Tools · 7 min read
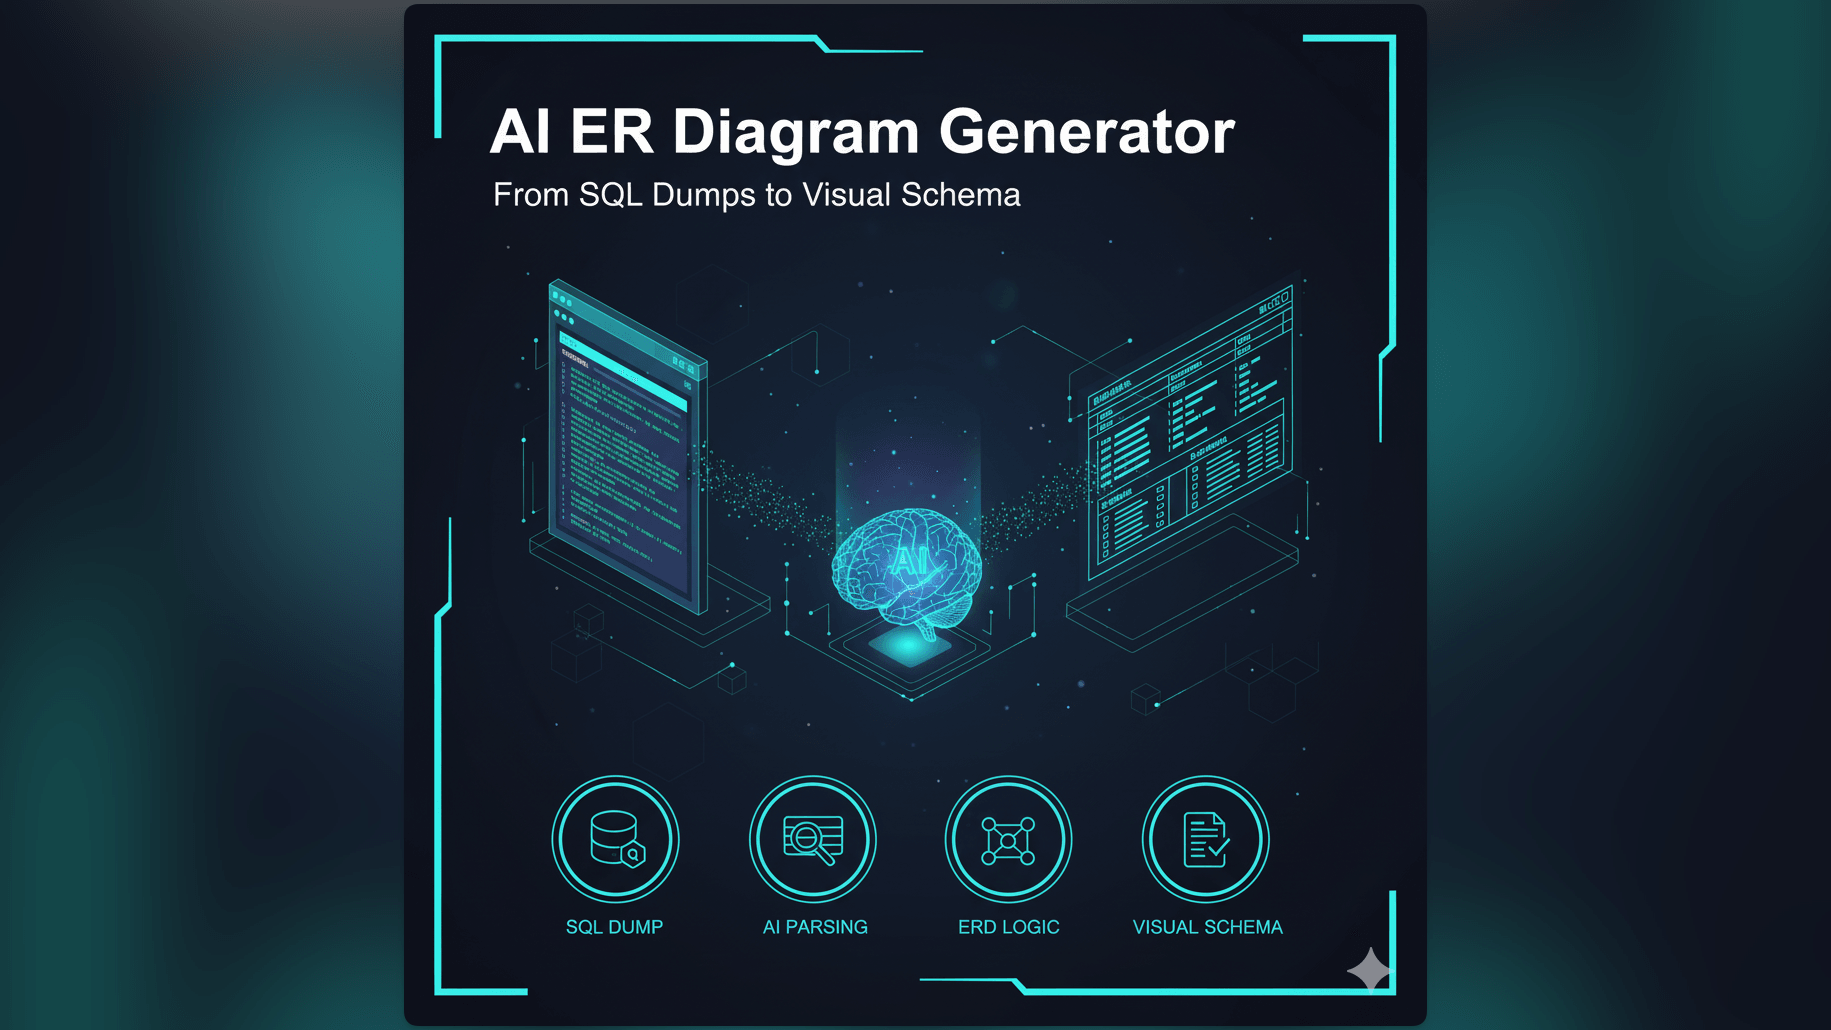
AI ER Diagram Generator: From SQL Dumps to Visual Schema
Stop manually transcribing SQL tables into boxes. Learn how an AI ER diagram generator can parse SQL dumps and CREATE TABLE statements into professional database schemas in seconds.
There is a sinking feeling every backend developer knows well. You join a new project. You ask the lead developer for the database documentation. They laugh nervously and send you a file called dump_2024.sql that is five hundred megabytes large.
You open it. It is thousands of lines of CREATE TABLE statements.
You see table names like users and orders which make sense. But then you see xref_usr_grp_7 and audit_log_v2_final. You see integer columns that look like they might be foreign keys but there is no constraint defined. You are expected to build a feature on top of this. You need to write a query that joins five of these tables. But you have no map. You are navigating a labyrinth in the dark.
Visualizing this structure is essential. An Entity Relationship Diagram or ERD is the map you need. It shows the entities, the relationships, and the data types. But creating one manually for an existing database is a punishment I wouldn’t wish on anyone. You have to read the SQL. You have to draw a box. You have to type every single column name. You have to draw the lines.
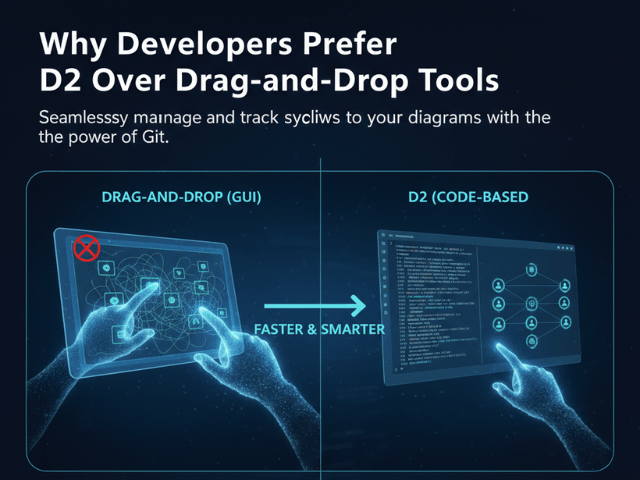
We built our ai er diagram generator to solve this exact problem. We turn that messy SQL dump into a clean visual schema instantly.
The Database Dilemma: Complex Schemas and the Need for Clarity
Databases are the source of truth for your application. If you don’t understand the database, you don’t understand the app.
Why ERDs are Indispensable for Database Design and Understanding
An ERD (Entity Relationship Diagram) is the only way to see the topology of your data. Code tells you how data is manipulated, but an ERD tells you what the data is.
It allows you to spot issues immediately. You might see a table that is completely disconnected from everything else. You might see a circular dependency that will cause deadlock issues. You might see a table with fifty columns that desperately needs normalization. Without a visual aid, you are forced to hold this complex graph in your short-term memory. That is a recipe for bugs.
The Manual Hassle of Drawing ER Diagrams for Large Databases
The reason most teams don’t have up-to-date ERDs is simple: the ROI of creating them manually is too low. If you use a traditional drag and drop tool, documenting a database with 50 tables takes days. You have to manually transcribe hundreds of column names.
And the moment you are done, a developer adds a new column or renames a table. Now your beautiful diagram is wrong. It is obsolete. Because keeping it up to date is so painful, nobody does it.
The Challenge of Visualizing Database Schema from Raw SQL
Reading raw SQL is a terrible way to learn a schema. SQL is a declarative language for machines, not for humans. When you look at a CREATE TABLE statement, the relationships are hidden in the FOREIGN KEY constraints at the bottom. You have to mentally jump back and forth between definitions to understand how things connect.
We realized that this is a perfect job for AI. A machine can parse SQL faster than any human. It can extract the structure and the relationships and layout the graph automatically.
Introducing AI Diagram Maker: Your Intelligent AI ER Diagram Generator
We built AI Diagram Maker to be the fastest way to visualize a database. We don’t make you draw boxes. We let you import your reality.
Transform SQL to ERD AI: The Power of Automated Schema Visualization
Our engine is designed to understand SQL dialects. Whether you are using PostgreSQL, MySQL, or SQLite, we parse the syntax. We identify the table definitions. We extract the column names and data types. Most importantly, we identify the Primary Keys and Foreign Keys.
These keys are the glue that holds your data together. Our AI uses them to draw the connector lines between the tables. It understands that if orders.user_id references users.id, there should be a relationship line connecting them.
How AI Parses Database Structures for Instant ERD Creation
The process is automated. You paste your SQL. The AI analyzes it. It builds an internal graph of the nodes and edges. Then it applies an intelligent layout algorithm. It tries to position related tables near each other, minimize line crossings, and group modules together.
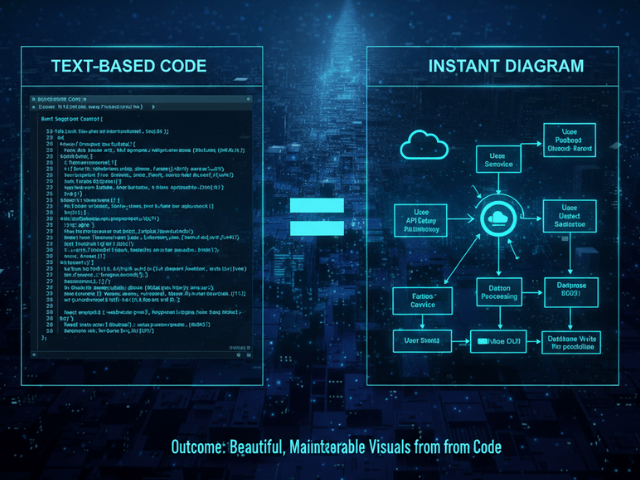
The result is a professional ERD that looks like you spent a week designing it. But it took five seconds.
Key Advantage: The “Import” Capability for Existing SQL Dumps
This is the game changer. We don’t just generate diagrams from prompts like “Create a user table.” We generate them from your actual code. You can take a pg_dump or a mysqldump file, copy the schema section, and paste it directly into our tool. We handle the parsing, ignore the data inserts, and focus on the structure. This is true “Reverse Engineering” for your database.
Practical Scenarios for SQL to ERD AI Generation
We see developers using this tool in critical moments of the software lifecycle.
Reverse Engineering a Legacy Database
This is the scenario we mentioned at the start. You inherit a mess. You need to understand it fast. We have a detailed breakdown of this in our scenario guide. The gist is that you can take the “black box” of a legacy database and turn it into a clear map. You can finally see the “ghost tables” that haven’t been used in years and relationships that were never properly documented.
Onboarding New Developers to Database Structures
When a new backend engineer joins the team, the first thing they need to learn is the data model. Instead of walking them through the codebase, you can generate an ERD from the production schema. You can print it out or put it on a wiki page.
“Here is our data model. The Payment module is over here in blue. The User module is over here in green.” It creates an instant shared mental model.
Documenting Evolving Database Designs for Audits
For companies in regulated industries like Fintech or Healthcare, documenting data storage is mandatory. You need to prove you know where the PII is stored. Generating these reports manually is a chore. With AI Diagram Maker, you can generate a fresh ERD before every audit. It is accurate because it comes from the code.
Validating Data Models Before Implementation
You can also use it for design. If you are planning a new feature, you can write the proposed SQL CREATE statements in a text editor. Paste them into AI Diagram Maker to visualize your design. You might spot a flaw, such as realizing a many-to-many relationship will make reporting difficult, before you ever migrate the production database.
Manual ERD Creation vs. AI Diagram Maker: Time Saved, Clarity Gained
The Traditional Process
- Open Lucidchart.
- Drag an “Entity” shape. Name it “Users”.
- Add fields like “id” (UUID) and “email” (VARCHAR).
- Repeat for 50 other tables.
- Draw lines and try to route them around the boxes.
- Realize you forgot a table.
The AI Approach
- Open your terminal. Run
pg_dump -s schema > schema.sql. - Copy the content.
- Paste into AI Diagram Maker.
- Click Generate.
The difference is not just speed: it is accuracy. The manual diagram is guaranteed to have typos. The generated diagram is a faithful representation of the source.
Effortless Updates: Adapting to Schema Changes with a Simple Re-import
Databases change. You add columns and indexes. With our tool, updating the documentation is just re-running the import. You paste the new schema and generate a fresh diagram. The visual updates, and you are always in sync.
Step-by-Step: Generating Your ER Diagram with AI Diagram Maker
- Importing Your SQL Dump or Describing Your Schema: Paste the
CREATE TABLEstatements. If you are designing from scratch, use plain English: “Create a database for a library with books, authors, and loans.” - AI Processes and Generates the Initial ERD: The engine identifies entities and relationships (like
author_idimplying a connection). It generates tables as boxes with columns and crow’s foot notation. - Reviewing, Refining, and Customizing: You can drag tables or use the chat: “Move the logs table to the bottom right” or “Color the users table blue.”
- Exporting to Share: Export as an SVG for your Pull Request description.
The Developer’s Guide to AI Diagramming discusses how this fits into the larger developer workflow, but for anyone touching a database, this tool is the difference between guessing and knowing.