· Data Visualization · 5 min read
Visualizing JSON Data Structures as Class Diagrams
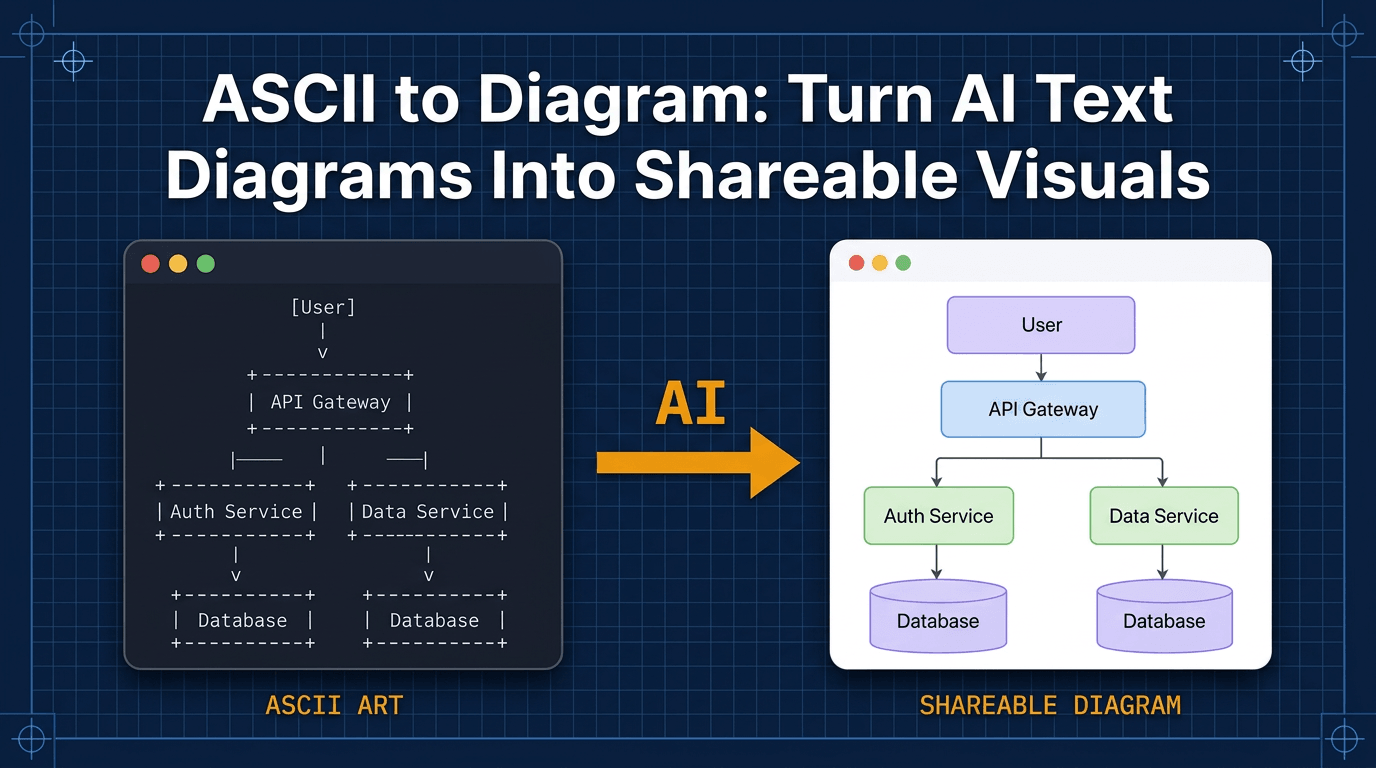
This guide explains how to use AI Diagram Maker to turn complex JSON into diagram visualizations, specifically mapping them as Class Diagrams to reveal the hidden data model.

JSON is the lingua franca of the web. Every API sends it. Every NoSQL database stores it. Every configuration file uses it. It is simple when it is small. But real-world JSON is not small. You hit an API endpoint and get back a 5000-line response. It has nested arrays of objects inside objects inside arrays. You try to read it. You collapse the folders in your text editor. You scroll up and down. You lose track of the structure. “Wait, does the Post object contain the Comments array, or does the User object contain a list of CommentIDs?” Text is a terrible way to understand hierarchy. You need a visual.
This guide explains how to use AI Diagram Maker to turn complex JSON to diagram visualizations, specifically mapping them as class diagrams to reveal the hidden data model.
Reading Raw JSON is Hard
JSON is designed for machines to parse, not for humans to read.
Nested Arrays and Objects
The nesting depth is the enemy. By the time you are five levels deep, you have forgotten the context of the parent object. Structure is implied by indentation, but indentation is fragile. One missed bracket, and the whole structure breaks.
Losing Track of Relationships in 1000 lines of JSON
In a relational database, relationships are explicit (Foreign Keys). In JSON, relationships are often implicit. You might have a list of users and a list of posts. The posts contain authorId. In the JSON text, these are just two separate lists. You have to mentally draw the line connecting them. When the file is huge, finding these connections is like playing “Where’s Waldo” with data.
Mapping JSON to UML Concepts
We solved this by mapping JSON structures to UML Class Diagram concepts.
JSON Objects = Classes
Every distinct object in your JSON becomes a Class box in the diagram. If you have a "user": {...} object, we draw a box labeled User.
JSON Fields = Attributes
The key-value pairs inside the object become the Attributes. "username": "john_doe" becomes username: string. "age": 30 becomes age: integer. We extract the types automatically, so you can see the data schema at a glance. Note that since JSON is data-only, these diagrams will not show methods, but they provide a perfect visual map of the data structure.
Nested Arrays = Relationships (Cardinality)
This is the most powerful part. If an object contains an array of other objects, we recognize that as a relationship. We draw a line connecting the Parent class to the Child class. We add “Cardinality” notation (like 1..*) to show that “One Parent has Many Children.”
Example: Visualizing a Blog Platform Data Model
Let us look at a real example. Imagine you have a JSON export from a blog platform. It contains Users, Posts, Comments, and Tags.
The Input: Users, Posts, Comments, Tags (JSON Snippet)
You have a JSON file that looks like this:
{
  "users": [
    { "id": "user_001", "username": "john_doe" }
  ],
  "posts": [
    { "id": "post_001", "authorId": "user_001", "title": "Web Dev" }
  ],
  "comments": [
    { "id": "comment_001", "postId": "post_001", "content": "Nice!" }
  ]
}
Reading this, you have to scan back and forth to match the IDs.
Prompt
Visualize this JSON as a class diagram with fields
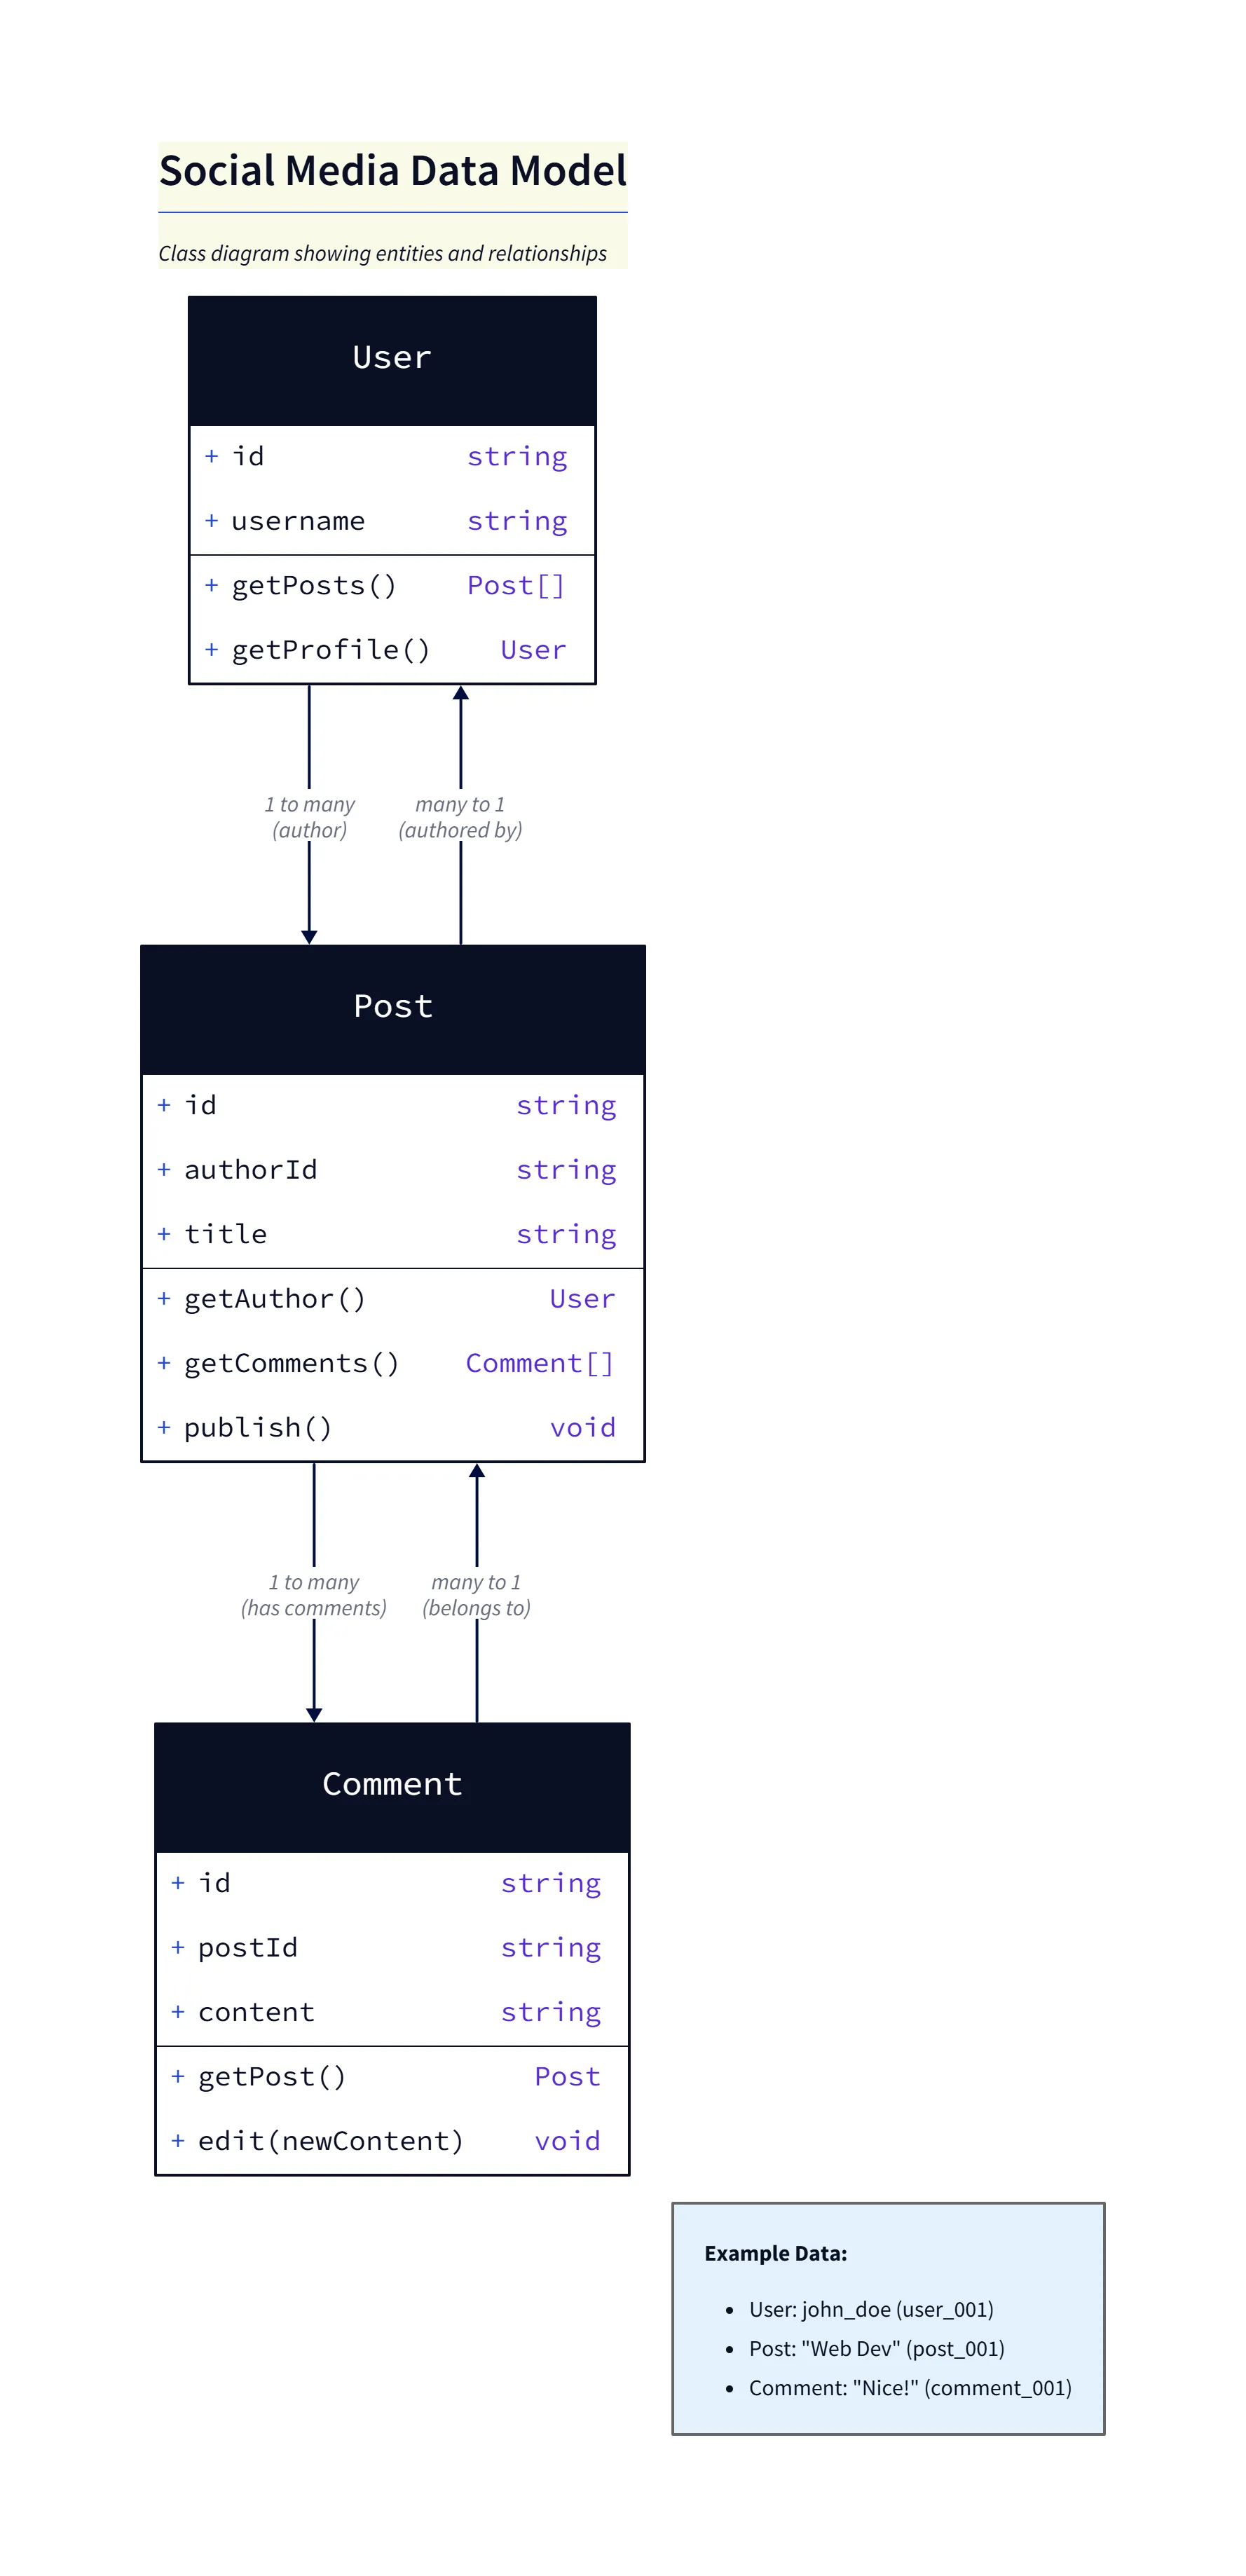
Diagram
Explanation
Overview: The generated class diagram maps each top-level JSON object to a UML class:
User,Post, andComment. Fields become attributes and inferred types are shown where possible.User: Contains
idandusername. The diagram shows that aUsercan author manyPostobjects (1 → * relationship).Post: Contains
id,authorId, andtitle. TheauthorIdfield is recognized as a reference toUser.id, so a relationship line connectsPosttoUser.Postalso relates toCommentviapostId.Comment: Contains
id,postId, andcontent. ThepostIdfield establishes the relationship back toPost(many comments belong to one post).
The Process: Parsing the Keys and IDs
You paste this into AI Diagram Maker. The prompt is simple: “visualize this json data with relationships. Use class diagram with just fields and not methods” Our AI parses the structure. It sees that posts have an authorId that matches the users ID format. It infers the relationship.
The Output: A Class Diagram showing User 1—N Post
The result is a clean UML Class Diagram. You see a User box. It is connected to a Post box with a line labeled writes. The line has a 1 on the User side and a * on the Post side. You see the Post box connected to a Comment box. Suddenly, the architecture of the blog is obvious. You see that it is a relational structure serialized into JSON.
How to Use AI Diagram Maker for JSON
Paste your JSON Payload
You do not need to format it. You do not need to remove the data values. Just paste the raw response from Postman or your database.
Prompt: “Visualize this as a class diagram with fields”
Give the AI a hint about what you want. Asking for a “class diagram” ensures you get the structured boxes. Asking for “fields” ensures you see the data keys.
Refining the Relationship Lines
Sometimes the AI might miss a subtle relationship if the naming convention is weird. You can fix it with chat. “Link Post to Tag based on postTags array.” The diagram updates instantly.
Use Cases
Documenting NoSQL (MongoDB) Schemas
MongoDB documents are just JSON. Visualizing a complex document helps you understand the schema design. You can see if you are embedding data (composition) or referencing data (aggregation).
Visualizing Complex API Responses
If you are a frontend developer consuming a massive GraphQL query or a legacy REST endpoint, pasting the response into our tool gives you the map you need to build your UI components.
This tool turns data into structure. It allows you to see the shape of the information you are working with.
The Programmable Diagram: A Developer’s Guide to D2 and Text-Based Visuals
Explore the full potential of text-based diagramming and how it can revolutionize your approach to data visualization and documentation in our comprehensive guide: The Programmable Diagram: A Developer’s Guide to D2 and Text-Based Visuals.