· Architecture · 2 min read
The "Architecture Decision Record" (ADR): Visualizing Trade-offs
This guide explains how Architecture Decision Records document trade-offs visually, creating an illustrated history book for your software.
You join a project. You look at the code. You ask “Why are we using MongoDB for a financial ledger?”
The team lead shrugs. “I don’t know. The guy who built it left last year. Maybe he liked JSON?”
This is a failure of architectural memory.
We make hundreds of decisions during a project. We choose libraries. We choose patterns. We choose databases.
Usually these decisions are lost in Slack threads or forgotten meeting notes.
The solution is the Architecture Decision Record (ADR). It is a lightweight document that captures a single decision and its context.
But text isn’t enough. To understand the trade-offs you need to visualize the options.
What is an ADR?
An ADR is a short text file stored in your repository. It has a standard format.
- Title: The decision.
- Context: The problem we were solving.
- Decision: What we chose.
- Consequences: The good and the bad.
Documenting the “Why” behind the “What”
The code tells you what the system does. The ADR tells you why it does it that way.
It prevents you from re-litigating the same arguments every six months. “We already discussed GraphQL vs REST. Here is the ADR explaining why we chose REST.”
Why Text Isn’t Enough for Trade-offs
Describing a complex trade-off in text is hard.
Comparing Option A vs Option B
“If we use Option A we need a load balancer but no cache. If we use Option B we need a cache but no load balancer.” It gets confusing.
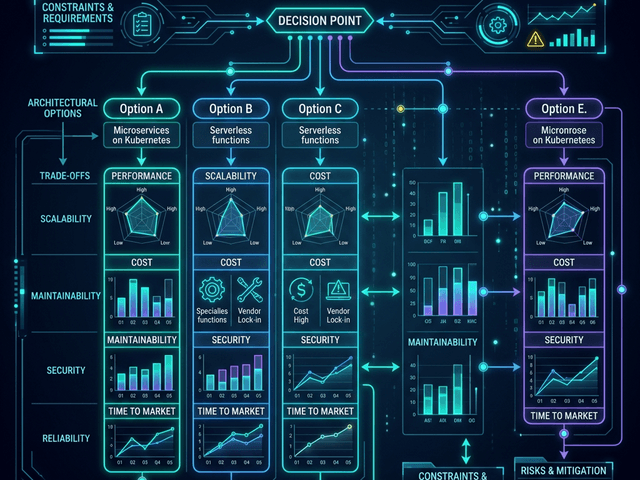
Visualizing the Decision Matrix
Visuals make the comparison instant.
Generating “Proposed Architecture” vs “Rejected Alternative”
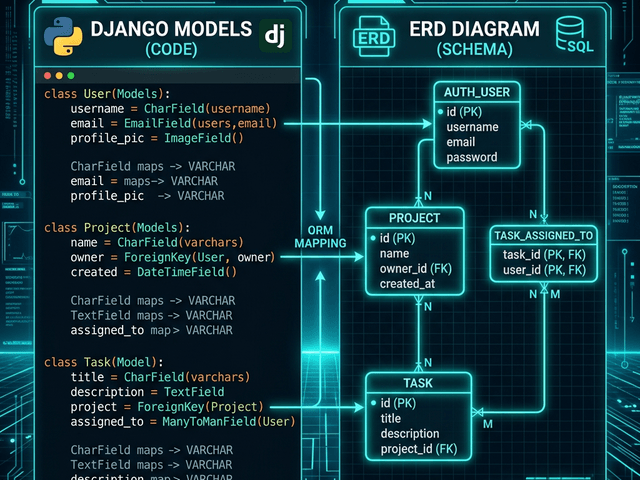
With AI Diagram Maker you can generate two diagrams.
Diagram A: Shows the MongoDB approach. Diagram B: Shows the PostgreSQL approach.
You put them side-by-side in the ADR. “See Diagram A? It requires complex application-level joins. See Diagram B? The database handles it.”
The visual evidence makes the decision obvious.
Workflow: Embedding Diagrams in Markdown ADRs
ADRs usually live in a docs/adr folder as Markdown files.
Using SVG exports in your ADR folder
Generate the diagrams. Export as SVG. Save them in docs/adr/images. Link them in the Markdown.
When a new developer reads the history they don’t just read the dry text. They see the evolution of the architecture. They understand the road not taken.
You are building a history book for your software. Make it an illustrated one.