· Architecture · 3 min read
Spring Boot Architecture: Visualizing Beans and Dependencies
This guide explains how to visualize spring boot application architecture to spot wiring issues and understand your layered design.
Spring Boot makes building Java applications easy. It handles the configuration. It wires your components together. It works like magic.
But when that magic breaks debugging it is a nightmare.
You get a BeanCreationException. The stack trace is fifty pages long. It says there is a circular dependency between OrderService and UserService.
You look at the code. OrderService injects UserService. UserService injects EmailService. EmailService injects… wait where does it loop back?
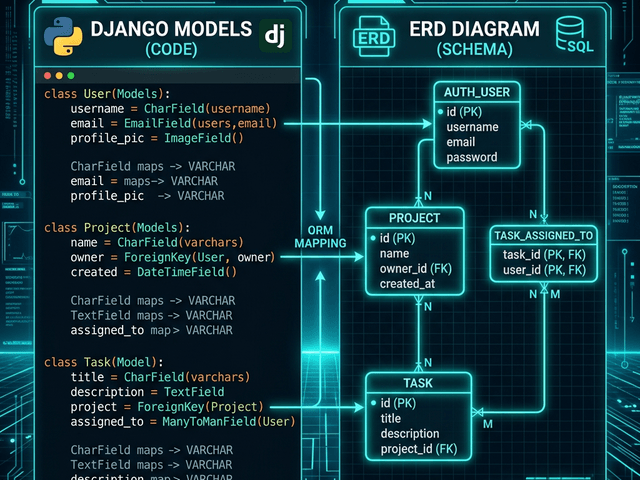
Because Spring wires things at runtime you can’t always see the structure just by looking at the file tree. You need to see the Dependency Graph.
This guide explains how to visualize spring boot application architecture to spot wiring issues and understand your layered design.
The Magic (and Confusion) of Dependency Injection
Dependency Injection (DI) is powerful. It allows for loose coupling. But it also creates an invisible web of connections.
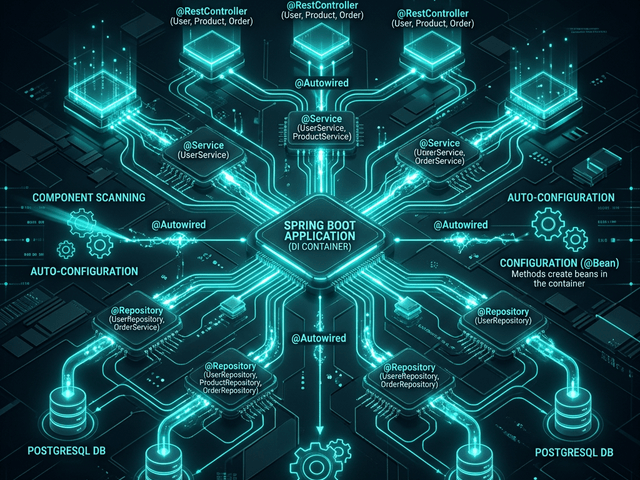
@Autowired and hidden wiring
When you put @Autowired (or constructor injection) on a field you are creating an edge in a graph.
If you have hundreds of beans finding the path from Controller A to Repository B is hard.
Visualizing this graph shows you the “weight” of your components. If one Service is injected into fifty other beans it is a critical node. If you change it everything breaks.
Mapping the Spring Layers
Spring apps usually follow a strict layered architecture. Controller -> Service -> Repository
- Controller: Handles the HTTP request.
- Service: Handles the business logic.
- Repository: Handles the database.
Visualizing this helps you enforce architectural purity. You should never see an arrow going from a Controller directly to a Repository. That skips the logic layer. A generated diagram makes this violation obvious.
Visualizing the Request Lifecycle
You can use the diagram to trace a specific feature. “Show me everything involved in the Checkout flow.”
The diagram filters the graph. You see the CheckoutController, the PaymentService, the InventoryService, and the TransactionRepository. You see the full slice of the application.
Workflow: Copying Service Classes to Diagram
You don’t need a heavy APM tool to see this. You can do it with your source code.
Extracting the wiring logic
Open your IDE. Copy the Service classes you are debugging. You don’t need the method bodies. You just need the class definition and the constructor/fields.
Generating the component graph
Paste them into AI Diagram Maker. The AI identifies the injected fields.
It draws a box for each Class. It draws an arrow for each Injection. If OrderService has private final UserService userService;, the AI draws OrderService -> UserService.
Debugging Cyclic Dependencies
This is the killer use case.
Spotting the loop visually before the app crashes
The text logs tell you there is a cycle. The diagram shows you where it is.
You see the arrows forming a circle. A -> B -> C -> A.
Once you see the loop you can fix it. You can extract a third service to break the dependency or use @Lazy injection if you are desperate.
Visualizing your Spring context turns the “Magic” of the framework into concrete understandable engineering.