· Architecture · 2 min read
Visualizing Event-Driven Architectures (Kafka/RabbitMQ Flows)
This guide explains how to visualize event-driven architecture, mapping Pub/Sub processes like Kafka and RabbitMQ to pinpoint lost events.
Event-Driven Architecture (EDA) is great for decoupling.
Service A sends an event. Service A doesn’t care who receives it.
But this decoupling creates a visibility gap. When things break you don’t know where the event went. Did it get stuck in the topic? Did the consumer crash? Did the consumer drop it?
Unlike a REST call where you get a 404 error an event just disappears into the void.
To manage an event-driven system you need to visualize the invisible paths. You need an event driven architecture diagram.
The Challenge of Invisible Events
Debugging EDA is like debugging a ghost.
Publishers don’t know about Consumers
The OrderService publishes OrderCreated. It has no idea that the EmailService and the InventoryService and the AnalyticsService are all listening.
If you change the event schema you break all three consumers. But you can’t see them in the code.
Debugging “Why didn’t that email send?”
You check the logs. “Event Published.” You check the email service logs. Nothing.
Without a map of the Topics and Queues you are guessing where the message got lost.
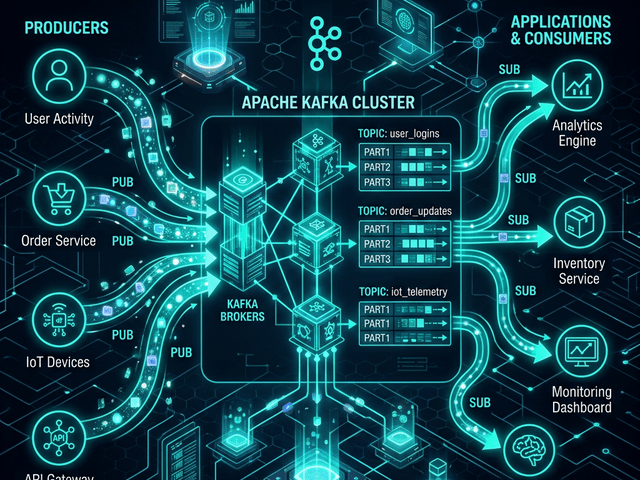
Modeling Pub/Sub Visuals
We model this by treating the “Topic” as a first-class citizen.
Defining “Topics” as nodes
In your diagram don’t just connect Service A to Service B. Connect Service A to Topic X. Connect Topic X to Service B.
This makes the “Broker” visible. It shows the buffer.
Visualizing the “Fan-out” pattern
You can show one arrow going into the Topic and three arrows coming out.
This visual “Fan-out” helps you understand the load. “Oh wow this one event triggers ten different downstream processes. No wonder the system is slow.”
Describing Async Flows to AI
You can define this easily in our tool.
Prompt: “Service A publishes to Topic X. Services B and C subscribe to Topic X.”
The AI draws the flow. It uses the correct arrows to indicate flow direction. You can also add details about the broker. “Topic X is a Kafka Partition.” “Queue Y is a RabbitMQ Dead Letter Exchange.”
Use Case: Ensuring Eventual Consistency
Eventual Consistency means the system will be consistent… eventually.
Visualizing the flow helps you spot race conditions.
If Service B updates the User Profile and Service C reads the User Profile but they both react to the same event concurrently who wins?
Seeing the parallel paths in the diagram alerts you to the race condition. It prompts you to add locking or versioning logic.
Visualizing your events turns the “Magic” of Pub/Sub into a concrete engineering pipeline.