· Database · 3 min read
Database Normalization Guide: Visualizing 1NF, 2NF, and 3NF
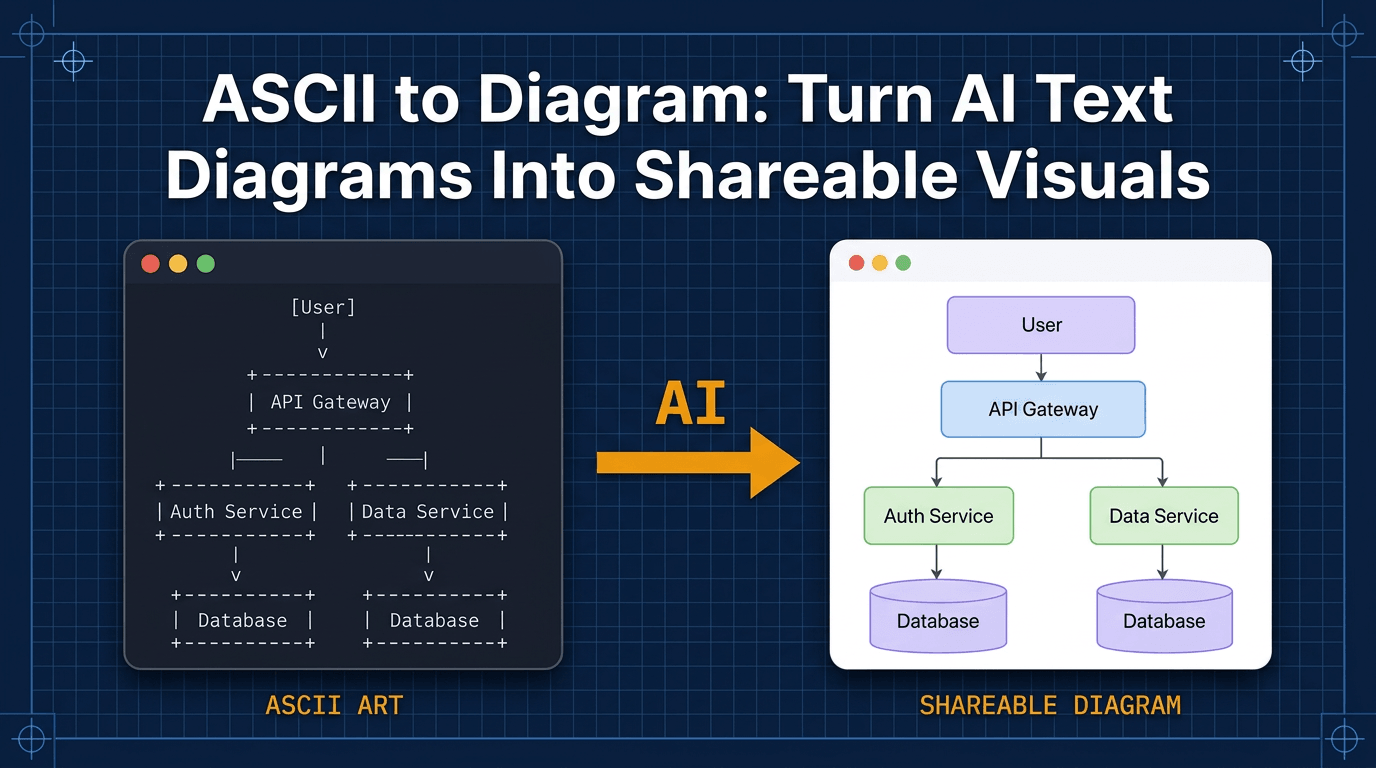
This guide uses AI visualization to teach normalization. We will watch a bad database transform into a good one by breaking it into 1NF, 2NF, and 3NF.
Database normalization is one of those topics that sounds academic and boring until you have to deal with a 50GB database full of duplicate data.
You query the database and find that “Customer Address” is stored in five different tables. And they are all different. One says “New York” and another says “NY.”
This is Data Anomaly hell.
Normalization is the process of organizing data to reduce redundancy. It is about storing each piece of data in exactly one place.
But the rules (1NF, 2NF, 3NF) are abstract. They are hard to understand just by reading definitions. You need to see the tables splitting.
This guide uses AI visualization to teach normalization. We will watch a bad database transform into a good one.
Why We Normalize Data
We normalize to protect data integrity.
Reducing redundancy and anomalies
If you store the customer’s email in the Orders table what happens when they change their email?
You have to update it in every single order row. If you miss one you have conflicting data.
Normalization says: Store the email in the Customers table. Reference it in Orders by ID. Now you only update it once.
Visualizing the Transformation
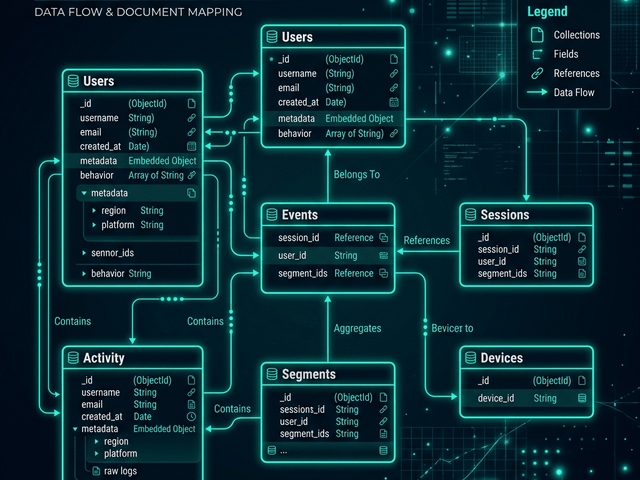
Let’s walk through the stages using an ERD generator.
Unnormalized (0NF): One giant spreadsheet table
Imagine a spreadsheet. Order ID | Date | Customer Name | Customer Email | Product Name | Product Price
It is simple but inefficient. Every time John Doe buys something we repeat his name and email.
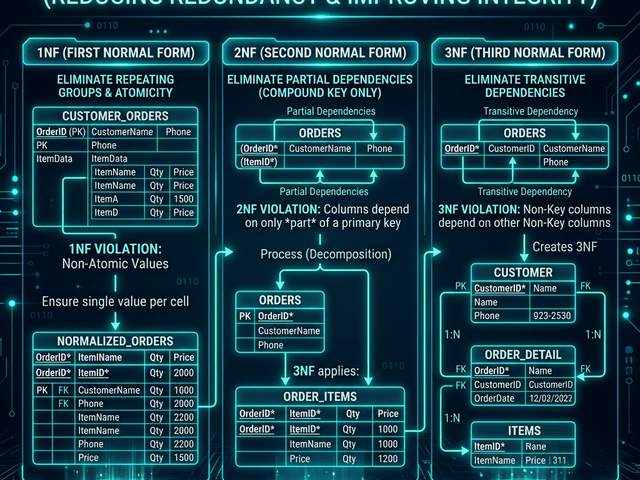
1NF: Eliminating repeating groups
We ensure every column holds one value. We don’t have comma-separated lists of products.
2NF/3NF: Splitting tables and linking via Foreign Keys
This is the big leap. We see that “Customer Name” depends on “Customer,” not the “Order.”
We create a Customers table. We create a Products table. We create an Orders table. We link them. Orders has customer_id.
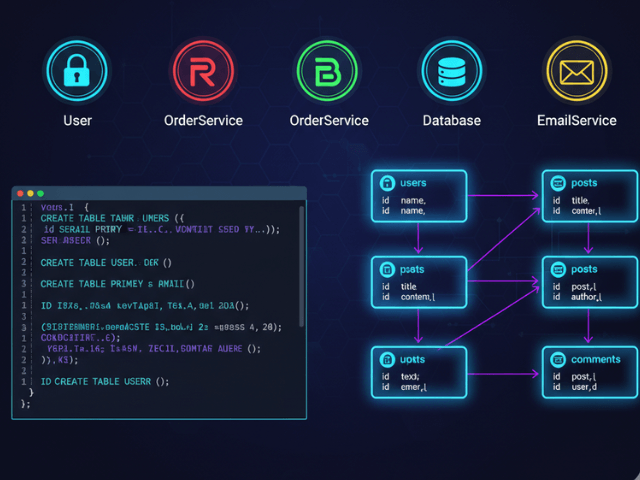
Using AI to Refactor Schemas
You can visualize this process with AI Diagram Maker.
Prompt: “Split this CustomerOrder table into Customers and Orders”
Paste the definition of the giant table. Tell the AI to normalize it. The AI generates a new ERD.
You see the giant box split into three smaller boxes. You see the lines connecting them.
Seeing the ERD change in real-time
This visual confirmation helps you verify the logic. “Oh I see. The Product Price moved to the Products table. But wait we need to store the historical price in the OrderItems table too.”
You catch the subtle design bug because you can see the schema.
Visualizing normalization makes the abstract rules concrete. It turns database theory into practical design steps.