· Tutorials · 8 min read
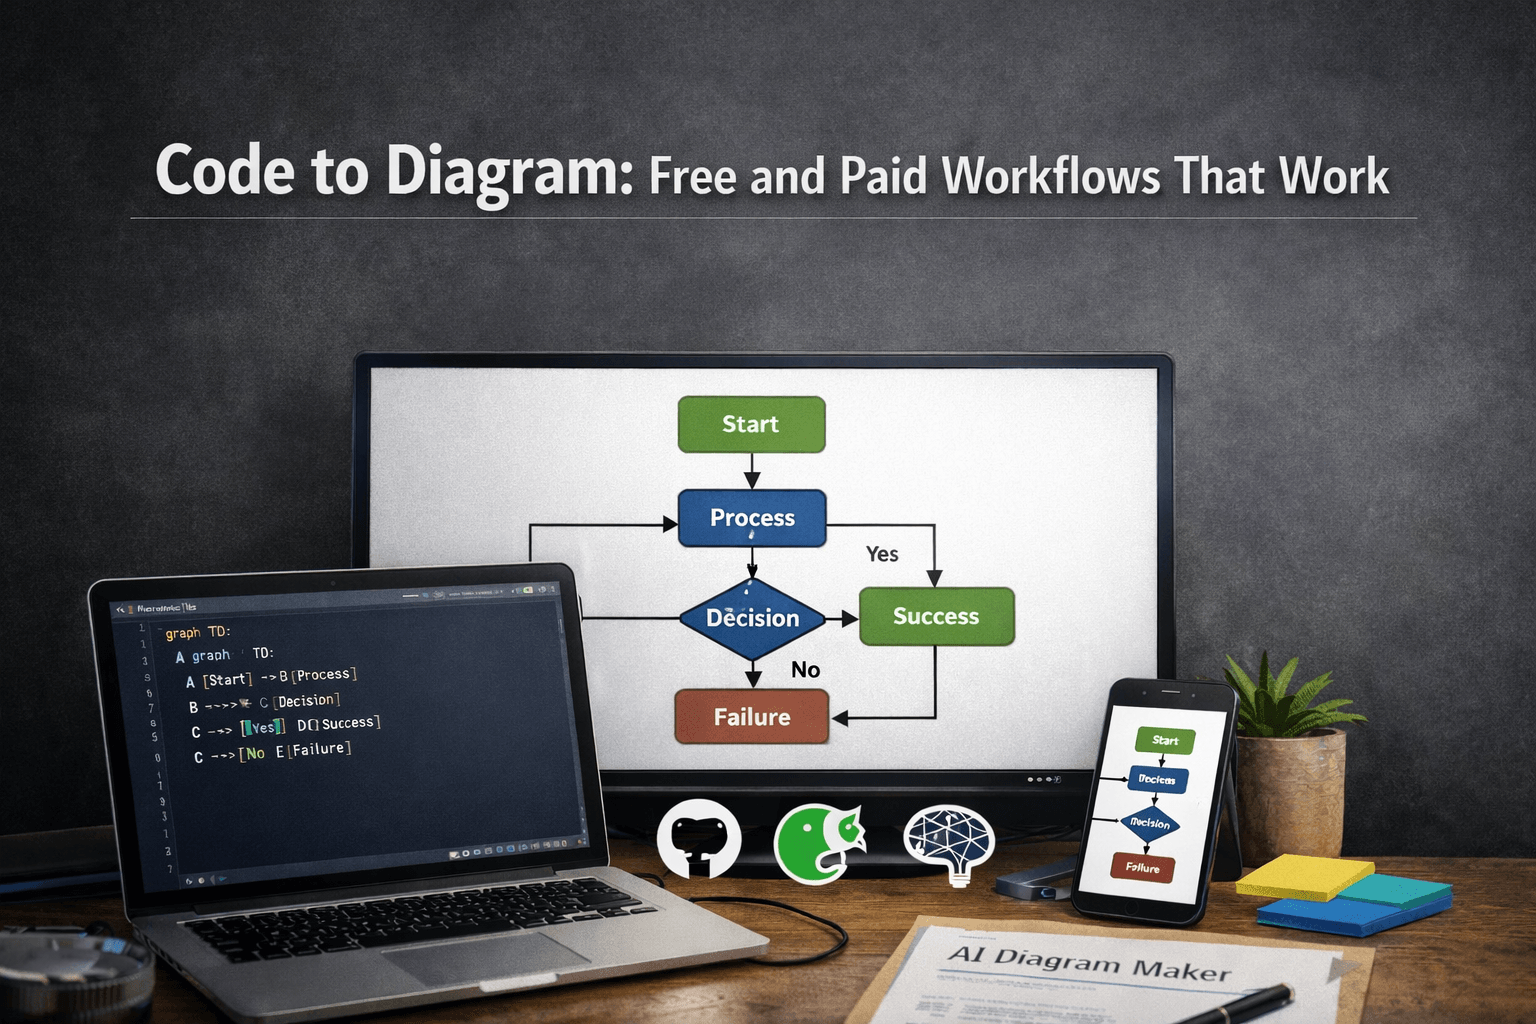
How to Generate Diagrams from GitHub Repositories Using AI
Stop manually drawing architecture diagrams. Learn how to use an AI GitHub diagram generator to turn your codebase into accurate, living documentation in minutes.

We have all felt that sinking feeling. You’re trying to understand a new part of the codebase, so you hunt down the architecture diagram on the company wiki.
You open it up, and you can just tell, deep in your gut, that it’s wrong. It’s a fossil. That service was renamed six months ago, and the diagram still shows the old message queue we deprecated last year. At that moment, the documentation goes from being a helpful guide to an active obstacle.
Tl;Dr
Your manually drawn diagrams are almost always out of date. The only true source of truth is your code. By connecting a tool like AIDiagramMaker directly to your GitHub repository, you can automatically generate an accurate, up-to-date architecture diagram in minutes. This guide walks you through the exact steps to create “living documentation” that you and your team can actually trust.
Introduction: Your Codebase is a Diagram Waiting to Happen
Manually created architecture diagrams are broken. It’s not a controversial statement; it’s just a fact of life in most software teams. They are almost always out of sync with the actual code running in production.
It’s not because developers are lazy; it’s because the process is backward. We spend weeks writing and refactoring code, and then we’re expected to spend hours manually recreating that work in a drawing tool. It’s a recipe for failure.
But what if we could flip that script? What if, instead of drawing a picture of what we think we built, we could generate a picture of what we actually built?
That’s the entire promise of connecting an AI-powered diagram tool directly to your GitHub account. It treats your repository as the single source of truth and turns your codebase into a clean, readable, and, most importantly, accurate diagram.
This article is your step-by-step guide on how to do exactly that. We’re going to walk through how to use AIDiagramMaker’s GitHub integration to finally create the kind of living documentation that everyone wants but almost no one has.
Why Connect Your Repository? The Case for “Git-Driven Diagramming”
Before we get into the “how,” let’s talk for a moment about the “why.” This is more than just a cool feature; it’s a fundamental shift in how we should approach documentation.
The Single Source of Truth: Your code doesn’t lie. It is the most brutally honest representation of your system. When a diagram is generated directly from that code, it inherits that honesty. There are no forgotten connections, no outdated service names. You get an accurate map of your system as it exists right now.
Zero Maintenance Documentation: This is the big one. Think about all the developer hours that have been poured into updating diagrams. It’s a huge time sink. When you can simply regenerate a diagram after a merge, you eliminate that entire category of work. This is the core idea behind the future of software documentation; it should be a byproduct of development, not a separate, manual chore.
Read More: Future of software documentation
Instant Project Onboarding: How do you explain a complex service to a new developer? You could talk for an hour, or you could give them an auto-generated diagram. It provides a complete visual overview in minutes and empowers them to get up to speed on their own.
Enhanced Code Reviews: This is a subtle but powerful benefit. Before you merge a big pull request, you could generate a “before and after” diagram of the affected components. This helps you visualize the true impact of the changes, leading to much smarter and safer code reviews.
Pre-requisites: What You’ll Need to Get Started
Okay, let’s get down to business. The process is pretty straightforward, but you’ll need a few things in place first.
- An AIDiagramMaker account (the GitHub integration is available on all plans, including the Free plan).
- A GitHub account (either personal or through your organization).
- A repository that you want to visualize. The tool supports most major languages like Python, Java, TypeScript, Go, and more.
That’s it. No complex setup or local installations required.
Step-by-Step Guide: Generating Your First Diagram from GitHub
We’re going to walk through the high-level steps here. I think you’ll be surprised at how quickly you can go from a repo to a full diagram.
Note: For the exact button clicks and detailed technical instructions, please refer to our official User Guide: Code to Diagram.
Step 1: Connecting Your GitHub Account
First things first, you need to let AIDiagramMaker talk to GitHub.
Inside your AIDiagramMaker dashboard, look for a section called “Integrations” or “Connections.” You’ll see the option to connect to GitHub. Clicking this will start the standard OAuth authentication process. GitHub will ask you to authorize AIDiagramMaker. It’s important to note that we request read-only access to your code. Your source code is not modified or stored, it’s simply analyzed in a secure environment.
Step 2: Selecting a Repository and Branch
Once your account is connected, you’ll be taken to a new screen where you can see a list of your available repositories. Simply find and select the one you want to work with.
Next, you’ll need to choose the specific branch. This is a key detail. You probably want to start with your main or develop branch to get a picture of your primary codebase, but you could just as easily point it at a feature branch to visualize work in progress.
Step 3: Configuring the AI Analysis
This is where you give the AI a little bit of direction. You’ll have a few options to help it generate the most useful diagram for your needs.
- Diagram Type: What kind of visual do you want? You can typically choose from a high-level Architecture Diagram, a detailed UML Class Diagram, or a Dependency Graph.
- Depth Level: Do you want a 10,000 foot view or a deep dive? You can tell the AI to scan the entire repository or to focus its analysis on a specific folder.
- Exclusions: Your repo is probably full of things you don’t need in a diagram, like the
node_modulesfolder or test files. You can tell the AI to ignore specific files to keep the final output clean.
Step 4: Generating and Reviewing the Diagram
Alright, this is the moment of truth. You’ve configured the analysis, so now you just hit the “Generate” button.
After a few moments, your diagram will appear on the screen. And it can be a pretty amazing thing to see for the first time. Components you knew existed are suddenly laid out in a logical way. You might even discover connections or dependencies you didn’t know were there. This is the kind of output that can instantly clarify a complex system, much like in this example of documenting a full SaaS architecture.
Read More: Documenting a full SaaS architecture
Fine-Tuning Your Diagram with Conversational Edits
Now, the first diagram the AI generates is the raw, unedited truth. It’s accurate, but it might not be perfect for your specific audience. Maybe it’s a little too detailed for a presentation to the product team.
This is where the interactive part comes in. The initial generation is just the starting point. You can now use natural language prompts to refine and edit the diagram.
- “This is great, but can you group the authentication services together into a single component called ‘Auth’?”
- “Highlight all the services that connect to the main PostgreSQL database.”
- “For a cleaner view, can you remove the logging modules?”
This conversational editing process allows you to quickly transform the raw architectural diagram into a polished, presentation-ready asset tailored to your exact needs.
Best Practices for Maintaining Living Diagrams
Generating a diagram is one thing. Keeping it useful over the long term is another. Here are a few best practices.
Routine Regeneration: Since you cannot automate this in the background just yet, make it a habit. Treat diagram generation like you treat running a final test suite. After you merge a major feature or refactor a module, take thirty seconds to log in, select your repo, and hit “Regenerate.” This simple habit ensures your documentation never drifts too far from reality.
Saving Key Views: You might not need just one diagram of your system. You might need a high-level view for managers and a detailed database schema for backend developers. You can create and save these different “views” so they are always just a click away.
Embedding Diagrams: Don’t let your diagram live in isolation. Export the generated SVG or PNG and embed it directly in your project’s README.md file or on your team’s Confluence page.
Conclusion: Treat Your Diagrams Like You Treat Your Code
By connecting your diagrams directly to your GitHub repository, you make a powerful statement. You’re deciding to treat your documentation as a first-class citizen, just like your code. You’re moving away from static, outdated images and toward dynamic assets that your entire team can rely on.
The result is more than just pretty pictures. It’s greater accuracy, massive efficiency gains for your team, and the peace of mind that comes from having documentation you can actually trust.
Ready to see your own architecture come to life? Connect your GitHub account to AIDiagramMaker today and get your instant diagram.
Read more about: Ultimate Guide to AI Diagram Generation