· Features & Comparisons · 8 min read
Text-to-Diagram vs. Code-to-Diagram: Which One Fits Your Workflow?
Should you describe your idea or analyze your code? We break down the key differences between text-to-diagram and code-to-diagram workflows to help you choose the right tool for the job.

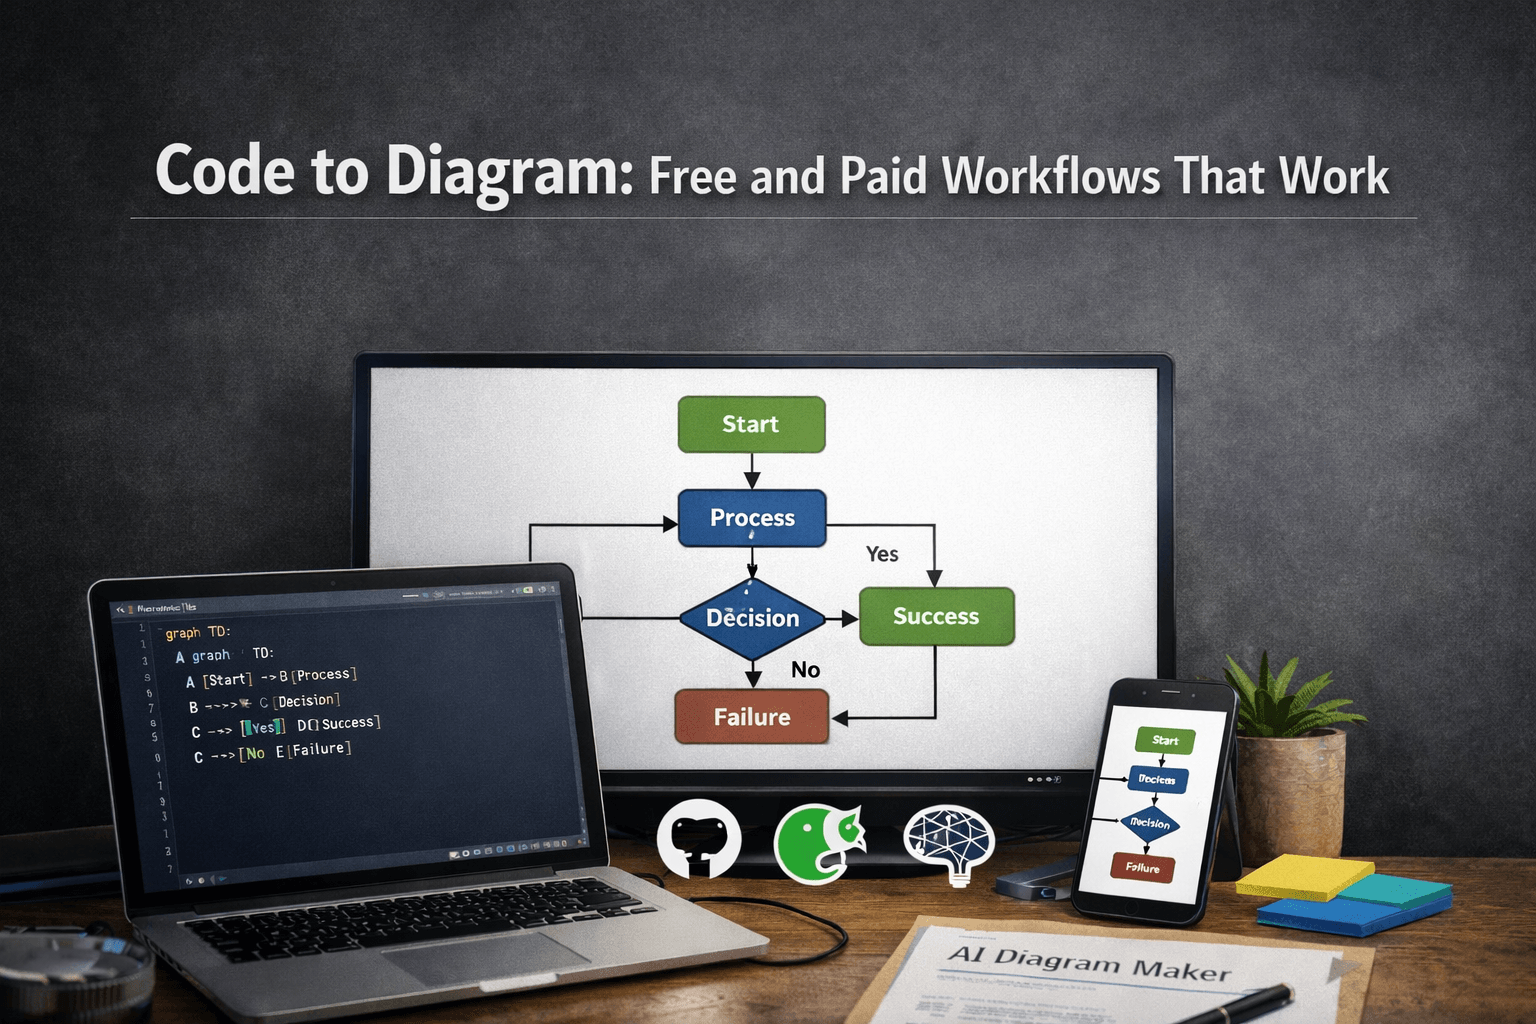
So, you’re ready to create a diagram. You have an idea in your head, maybe some notes scribbled down, or an entire codebase sitting in front of you. With a tool like AIDiagramMaker, you know you don’t have to manually drag and drop boxes anymore.
But this presents a new, interesting choice: should you describe your idea in plain English, or should you point the AI at your existing code? This isn’t just a technical question; it’s about matching the tool to the task at hand.
Tl;Dr:
The choice is simpler than you think. Use Text-to-Diagram when you’re in the creative, brainstorming, or planning phase. It’s for designing what could be. It’s perfect for product managers, architects, and developers sketching out new ideas. Use Code-to-Diagram when you need to understand, document, or analyze an existing system. It’s for understanding what is. It gives you the ground truth of your codebase. The most effective teams don’t pick one; they use both as part of their complete development lifecycle.
Introduction: Two Powerful Inputs, One Revolutionary Outcome
Let’s be honest, AI diagramming can feel a bit like magic. But it’s not a one-size-fits-all kind of magic. The real power of a tool like this comes from its flexibility, and a huge part of that flexibility lies in how you provide the initial input. The two primary methods, describing your vision with plain language (Text-to-Diagram) and parsing a system that already exists (Code-to-Diagram), aren’t just different features. They represent two fundamentally different ways of thinking and working.
Choosing the right one for your specific situation can be the difference between a good workflow and a great one. The goal of this article is to help you understand the distinct advantages of each approach. We’ll explore when to have a conversation with the AI and when to ask it to read your code, so you can move from early brainstorming sessions to documenting complex legacy systems with total confidence.
Understanding Text-to-Diagram: The Power of Conversation
What It Is and How It Works
At its core, the text-to-diagram feature is an expert translator. It uses powerful Natural Language Processing (NLP) models, the same kind of tech that powers chatbots like ChatGPT, to understand your instructions. When you type a prompt like, “Show a simple user authentication flow with a database check,” the AI isn’t just looking for keywords. It’s parsing the grammar, identifying the entities (user, database), and understanding the relationships (the flow between them) to produce a structured, logical diagram.
There’s no special syntax to learn, no code to write. It’s a blank canvas, and your words are the paint. It’s probably the most intuitive way to get an idea out of your head and onto the screen. It feels less like using a tool and more like collaborating with a design assistant who just happens to be incredibly fast.
The Best Use Cases for Text-to-Diagram
This conversational approach really shines when you’re operating in the world of ideas, before things get locked down by code.
Brainstorming and Ideation: This is the big one. You have a new concept for a feature, and you just need to see it laid out. Before you worry about which programming language to use or what the database schema will be, you can quickly visualize the core logic. It’s a friction-free way to explore different possibilities.
High-Level System Overviews: Sometimes you need to explain an architecture to less technical stakeholders, like management or a new client. You can create a simplified, clean diagram without getting bogged down in implementation details.
Process and Workflow Mapping: This is a lifesaver for Product Managers and Business Analysts. You can take a pile of messy meeting notes and turn them into a polished, professional flowchart that confirms everyone is on the same page. It’s a fantastic way to bring clarity to a brainstorming session.
API Flow Design: Before you write a single endpoint, you can sketch out the entire sequence of calls. It helps you think through the interaction between different services in a really clear way, often revealing potential issues before they become code.
Read More: sequence of calls
Who It’s For
While anyone can use it, text-to-diagram is a true superpower for Product Managers, Business Analysts, Solution Architects, and Developers who are in the early design and planning phases of a project.
Understanding Code-to-Diagram: The Ground Truth of Your System
What It Is and How It Works
Where text-to-diagram is about visualizing what could be, code-to-diagram is about understanding what is. This process involves pointing the AI at a codebase, whether it’s a single file, a folder, or an entire GitHub repository. The AI then acts like an incredibly diligent senior engineer on a code review. It meticulously parses the source code, mapping out the classes, functions, dependencies, and relationships between every component.
It doesn’t guess, and it doesn’t infer intent from a conversation. It reads the actual implementation. The resulting diagram, whether it’s a UML class diagram or a high-level architecture map, is a direct reflection of what has actually been built. It is, in a very real sense, the ground truth.
The Best Use Cases for Code-to-Diagram
The power here is in its accuracy and its ability to handle complexity that would be nearly impossible to diagram by hand.
Documenting Existing Systems: This is its killer feature. We’ve all been there: you inherit a legacy system with zero documentation, and you have to spend weeks just figuring out how it all fits together. Code-to-diagram can give you a detailed visual map of that entire system in minutes.
Read More: detailed visual map of that entire system
Onboarding New Developers: Imagine giving a new hire an accurate, up-to-the-minute architecture diagram on their very first day. It dramatically shortens their ramp-up time and gives them the context they need to start contributing safely.
Code Refactoring and Analysis: Before you undertake a major refactor, you need to understand the potential blast radius. Generating a dependency graph can show you exactly which other parts of the system will be affected by your changes, which is invaluable for planning.
Automated Documentation Pipelines: This is where things get really futuristic. By integrating diagram generation into your CI/CD pipeline, you can create a system of “living documentation” that is never out of sync with your code. It’s a core principle of the whole Diagram as Code movement.
Read More: Diagram as Code
Who It’s For
This workflow is built for the hands-on practitioner: Software Developers, Tech Leads, DevOps Engineers, and System Architects who need an accurate picture of how their systems operate right now.
A Head-to-Head Comparison: Feature Breakdown
To make it even clearer, let’s put the two workflows side-by-side in a simple table.
| Feature | Text-to-Diagram | Code-to-Diagram |
|---|---|---|
| Speed | Instant (for new ideas) | Nearly Instant (for existing code) |
| Accuracy | Reflects your description | Reflects the actual code |
| Use Case | Design & Brainstorming | Documentation & Analysis |
| Required Input | An idea in plain English | A codebase or GitHub repo |
| Audience | Technical & Non-Technical | Primarily Technical |
The Hybrid Approach: Using Both for a Complete Workflow
Here’s the thing: the most productive teams I’ve seen don’t treat this as an either/or choice. They see these two methods as two complementary tools in their belt, and they use them together to cover the entire lifecycle of a feature. Think about a typical workflow:
Step 1 (Text-to-Diagram): A Product Manager, after a meeting, uses a natural language prompt to create a high-level flowchart of a new user onboarding experience. This becomes the shared artifact for discussion with the engineering team.
Step 2 (Development): The development team takes that agreed-upon flowchart as a visual spec and implements the feature.
Step 3 (Code-to-Diagram): After the code is merged, the team uses the AI to generate a detailed sequence or class diagram directly from the new code in the GitHub repository. This highly accurate diagram is then added to the official technical documentation.
This hybrid approach gives you the best of both worlds. You get the creative freedom and cross-functional alignment of text-to-diagram at the beginning, and the technical accuracy and automated maintenance of code-to-diagram at the end.
Conclusion: Your Idea, Your Code, Your Choice
So, which AI workflow should you choose? The answer is, “the one that helps you solve today’s problem.”
If you’re staring at a blank page and trying to bring a new idea to life, start talking to the AI. Text-to-Diagram is for creating and designing.
If you’re looking at a screen full of code and trying to understand how it all works together, let the AI read it for you. Code-to-Diagram is for documenting and understanding.
A truly great tool doesn’t force you into a single way of working. It provides a flexible solution that adapts to your needs. AIDiagramMaker was built from the ground up to excel at both, giving you a comprehensive toolkit for the entire software development lifecycle.