· Scenario · 6 min read
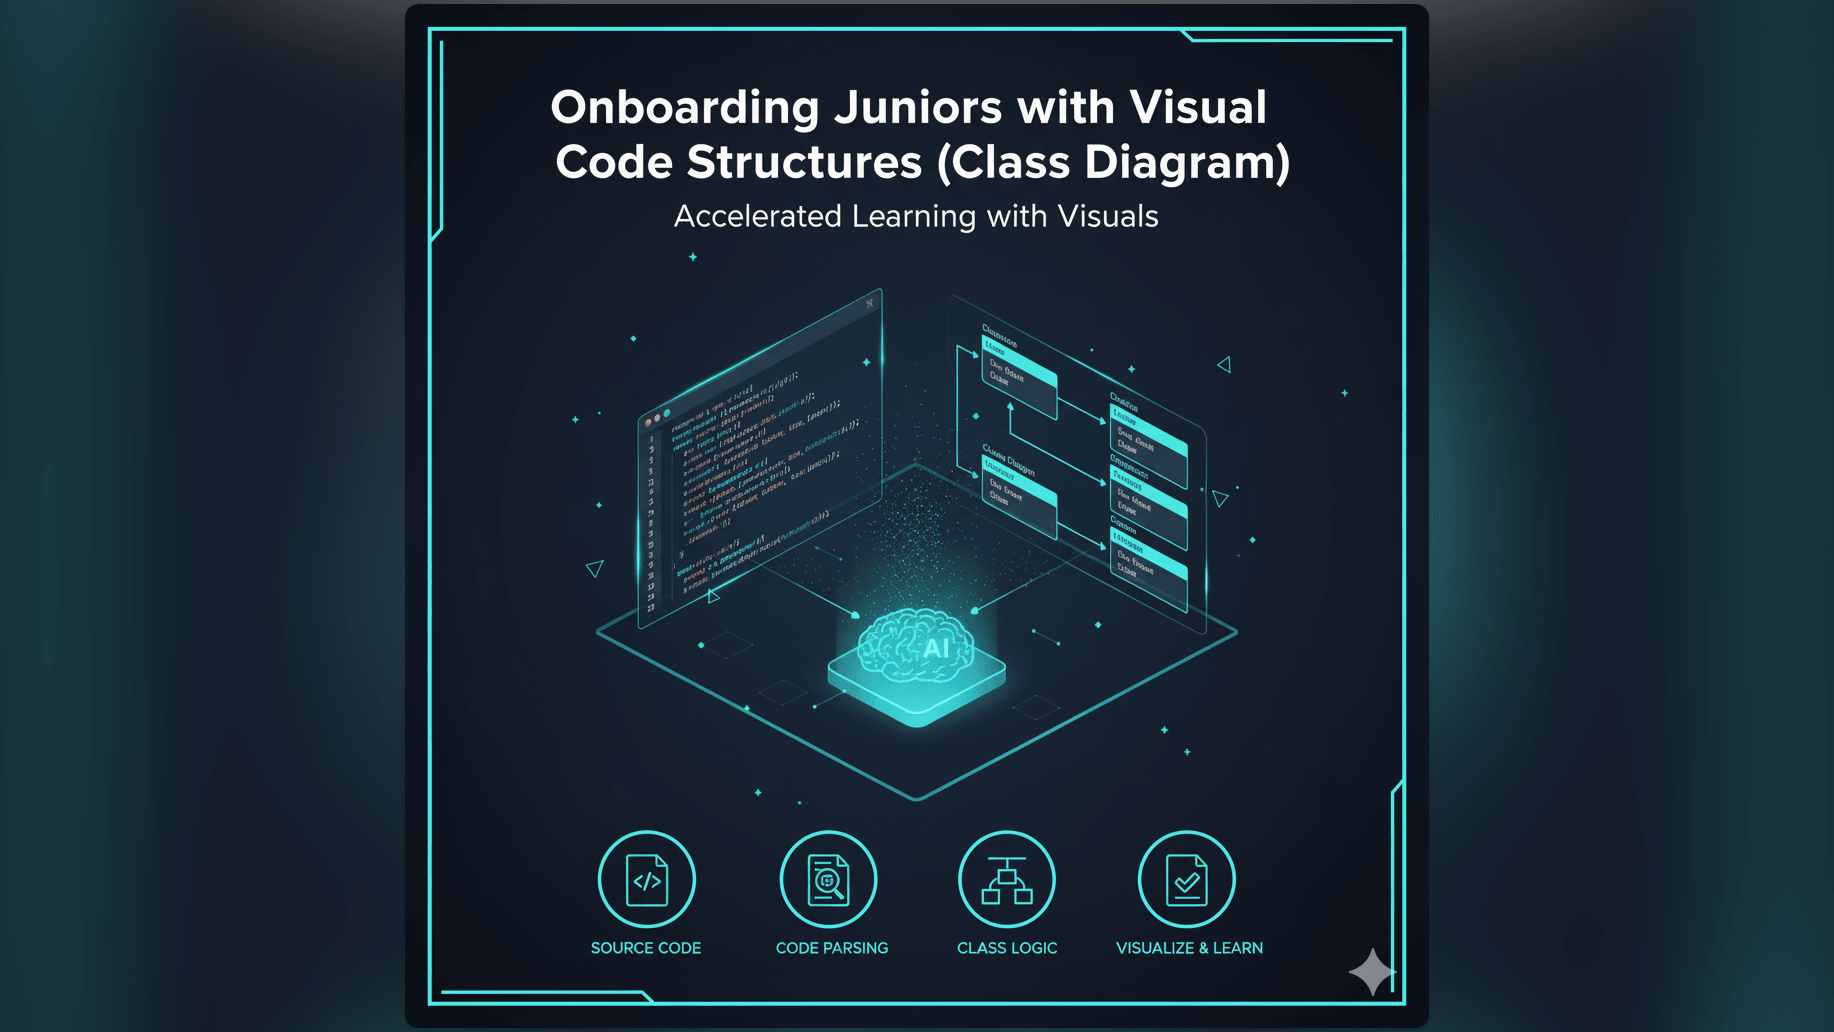
Scenario: Onboarding Juniors with Visual Code Structures (Class Diagram)
Monday morning onboarding doesn't have to be a nightmare of forty open tabs. Learn how to use an AI class diagram generator to bridge the knowledge gap for new hires and explain complex repo structures in minutes.
Monday morning arrives. You have a new notification in your calendar: “Onboarding Session with Alex.”
Alex is your new junior developer. They are smart and graduated top of their class. But today they look terrified. They have just cloned the company repository for the first time. They are staring at a file tree with twelve thousand files.
You pull up a chair next to them. “Don’t worry,” you say. “It is not as complicated as it looks.”
But deep down you know that is a lie. It is complicated.
You built this system over three years. You know that the OrderService inherits from the BaseTransaction class but only on Tuesdays (metaphorically speaking). You know the hidden dependencies. Alex knows nothing.
You start opening files. “Okay so this is the User model. And it talks to the Profile model. Oh wait let me open the Profile file. Hang on where is that interface defined again?”
Ten minutes later you are forty tabs deep in VS Code. Alex is nodding politely but their eyes are glazed over. You aren’t teaching them the architecture. You are just showing them that you can click tabs really fast.
There has to be a better way to explain the “Big Picture.” You need a map.
The Real-Life Challenge: Bridging the Knowledge Gap for New Developers
Onboarding is the most expensive phase of hiring. Until a developer understands the system, they cannot contribute value. In fact, they are often a net negative because they consume the time of senior engineers.
The Struggle of New Hires to Grasp Large, Complex Codebases
The problem isn’t that the code is hard to read line-by-line. The problem is the relationships. Code is linear text. But software architecture is a web.
When a new hire looks at a single file, they lack the context. They see a method call but they don’t know who calls it or what it impacts. They are trying to assemble a million-piece puzzle without looking at the picture on the box.
The Time-Consuming Process of Explaining Object-Oriented Design Manually
Explaining Object-Oriented Design concepts abstractly is easy: “A Car is a Vehicle.”
Explaining your specific OOD implementation is hard: “Our AbstractRequestFactory implements the RequestProvider interface but is instantiated by the SingletonManager.”
Trying to verbalize these structures is inefficient. The human brain struggles to process complex graphs through audio descriptions. We need visuals.
The Need for Clear, Visual Aids to Accelerate Onboarding
We need a way to show the structure instantly. We need to say “Look at this box. It connects to that box. That is why the code works that way.”
The Old Way: Text-Heavy Explanations and Manual Drawings Fall Short
Most teams try to solve this with documentation or whiteboards.
Relying Solely on Code Reviews and Verbal Explanations
“Just read the code.” That is the most common advice given to juniors. It is also the least helpful. Reading code to learn architecture is like reading every street sign to learn the layout of a city. It works eventually, but it takes years.
Spending Hours Drawing Class Diagrams on Whiteboards That Fade
The “good” mentors will draw a diagram on a whiteboard. This helps. But whiteboards are temporary. You draw the diagram, the junior understands, then you erase it. Two days later, the junior forgets the specific relationship between the User and the Account. The reference is gone.
Inconsistent Understanding Across New Team Members
If you have three new hires, you probably explain the system three slightly different ways. This leads to inconsistent mental models across the team. One dev thinks the system works one way while another thinks it works differently.
Introducing AI Diagram Maker: Your AI Class Diagram Generator for Fast Onboarding
We built AI Diagram Maker to turn your code into that missing map instantly.
Generate Instant UML Class Diagrams from Code or Description
Our tool bridges the gap. You don’t need to draw: you just grab the actual code from the repo.
You copy the messy, complex files that are confusing the new hire. You paste them into our tool. Our AI parses the syntax and renders a professional UML Class Diagram.
A Visual Map for “Explaining the repo to a new hire” in Minutes
Suddenly the abstract becomes concrete. You are no longer talking about “files”: you are pointing at “Classes.”
“See this arrow?” you can say. “That means Order inherits from Transaction. That is why you can call the save() method on it even though it is not defined in the Order file.”
Transform Abstract Concepts into Concrete Visuals
This visual aid creates an “Aha!” moment. The junior stops trying to memorize file paths and starts understanding the system design.
AI Diagram Maker Workflow: Visualizing Code for New Hires, Step-by-Step
Here is how you can transform your next onboarding session.
Step 1: Inputting Key Classes or Code Snippets from the Repo
You are sitting with the junior. They are confused about the “Payment Module.” Open your IDE. Select the PaymentService.java, StripeAdapter.java, and PaymentInterface.java files. Copy the code.
Step 2: AI Generates a Comprehensive Class Diagram
Open the AI UML Class Diagram Generator. Paste the code. You don’t need to format it or remove the imports. Just paste and click Generate.
Step 3: Guiding the Junior Through the Visual Structure
Now you have a diagram on the screen. This is your teaching tool. Walk them through it: “Okay let’s trace the path. The User creates a Payment. The Payment uses the Adapter. The Adapter talks to Stripe.”
You can use the chat feature to simplify the view if it is too complex: “Hide the private properties” or “Only show the public methods.” This keeps the focus on the high-level architecture.
Step 4: Discussing Relationships and Design Principles
The diagram makes the Object-Oriented Design patterns visible. It turns a lecture into a demonstration where you can show exactly why a Factory pattern or a Singleton was used.
The Output: Accelerated Understanding and Empowered Juniors
The result is a developer who feels confident.
- New Hires Grasp the Codebase Faster: Instead of taking three months to feel productive, they might feel productive in three weeks. They have a mental map they can refer to.
- Reduces Mentor Time: You can save the diagram and pin it in the team Slack channel or the repo README. The next time a junior asks how a module works, you can just send them the link to the diagram.
- Fosters a Deeper Understanding of Software Architecture: You are not just teaching them your code: you are training them to look for relationships and patterns, which is the hallmark of a senior engineer.
Who Benefits Most from AI-Driven Visual Onboarding?
- Senior Developers and Architects: You save your voice and your sanity. You spend less time navigating file trees and more time explaining concepts.
- Engineering Managers: You reduce the “ramp-up time” for new hires, which directly impacts the team’s velocity and budget.
- New Hires: They feel supported and equipped to do their job, reducing the imposter syndrome often felt when facing a massive codebase.
- Teams Undergoing Knowledge Transfer: Use this tool to generate diagrams before a senior developer leaves, ensuring a legacy of documentation rather than a black hole of knowledge.
Stop trying to explain architecture with hand gestures and open file tabs. Give your new hires the map they deserve. Use AI Diagram Maker to create visual maps of your codebase for your next new hire. It is the kindest thing you can do for a junior developer.