· Scenario · 6 min read
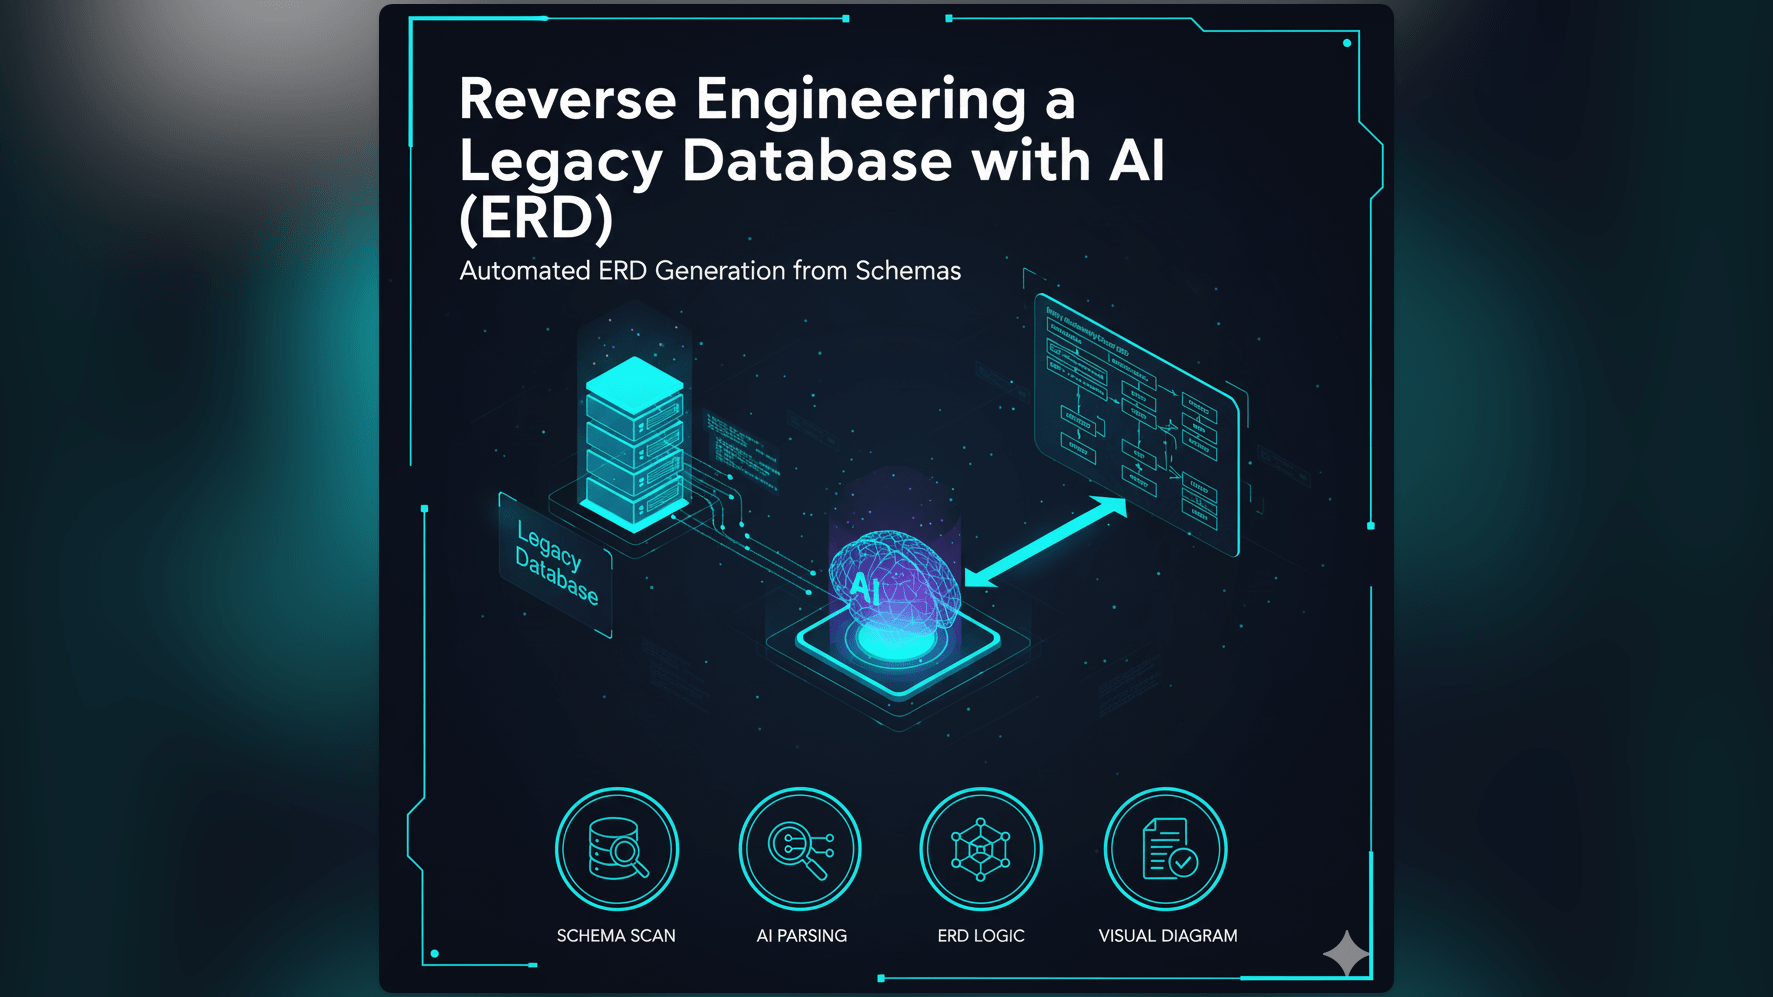
Scenario: Reverse Engineering a Legacy Database with AI (ERD)
Inheriting an undocumented legacy database is a developer's nightmare. Learn how to use an AI ER diagram generator to reverse engineer raw SQL dumps into clear, actionable visual schemas in seconds.
It is 4 PM on a Friday. Your team lead drops a message in Slack.
“Hey we are acquiring that small competitor. Their tech team is gone but we have their source code and a database dump. Can you take a look and tell me how hard it would be to migrate their user data to our system?”
You download the file. It is called backup_prod_final.sql. You open it in your text editor. It is 15,000 lines long. You see CREATE TABLE statements for tables named tbl_usr_data and xref_log_7. You see columns named p_id and f_id with no comments explaining what they link to.
Your heart sinks. You are staring at a black box. You have to figure out how this system works by reading raw SQL code. It is like trying to understand the architecture of a building by looking at a pile of loose bricks.
You need a map. You need an Entity Relationship Diagram (ERD). But nobody created one.
This is the classic “Legacy Database” nightmare. We built our ai er diagram generator to wake you up from it.
The Real-Life Challenge: Deciphering the Secrets of an Old SQL File
Every developer faces this eventually. You inherit a project where the documentation is missing, outdated, or written on a napkin that was lost three years ago.
The Common Pain Point: Inheriting Undocumented or Poorly Documented Databases
When you don’t know the structure of the database, you are paralyzed. You cannot write a query because you don’t know the table names. You cannot delete a record because you don’t know if it will break a cascading foreign key constraint. You are flying blind.
Why Understanding a Legacy Database Schema is Critical for Maintenance and Migration
In this scenario, you need to plan a data migration. You need to know that the users table is connected to the orders table which is connected to the transactions table. If you miss one of these connections, you will leave data behind. You will create “orphaned records” that pollute your new system. Understanding the web of relationships is the only way to migrate safely.
The Time Sink of Manually Mapping Entities and Relationships
To map this out manually, you would have to act like a human compiler. You would scroll to line 400 to find the users table definition. You would write down the column names on a notepad. Then you would search for FOREIGN KEY. You find one on line 5000. It points back to users. You draw a line on your paper.
Doing this for 50 or 60 tables takes days. It is tedious. It is boring. And it is incredibly prone to error.
The Old Way: Manual ERD Creation from SQL Dumps is Tedious
Most developers try to use a drag-and-drop tool to visualize this.
Sifting Through Hundreds or Thousands of Lines of SQL
You open the SQL file on one monitor and your diagram tool on the other. You read. You type. Your eyes start to glaze over after the twentieth table. You stop checking the data types. You just want to get it done.
Manually Identifying Tables, Columns, Primary Keys, and Foreign Keys
The hardest part is the relationships. In raw SQL, relationships are defined by constraints often at the bottom of the table definition. You have to mentally match user_id in the orders table to id in the users table. If the original developer used inconsistent naming conventions (like u_id vs user_id), you have to guess.
The High Risk of Errors and Omissions in Complex Schemas
Because it is so hard, you usually only map the “important” tables. You ignore the logging tables or the lookup tables. But those ignored tables are often where the technical debt is hiding. By skipping them, you create a map that is incomplete and dangerous.
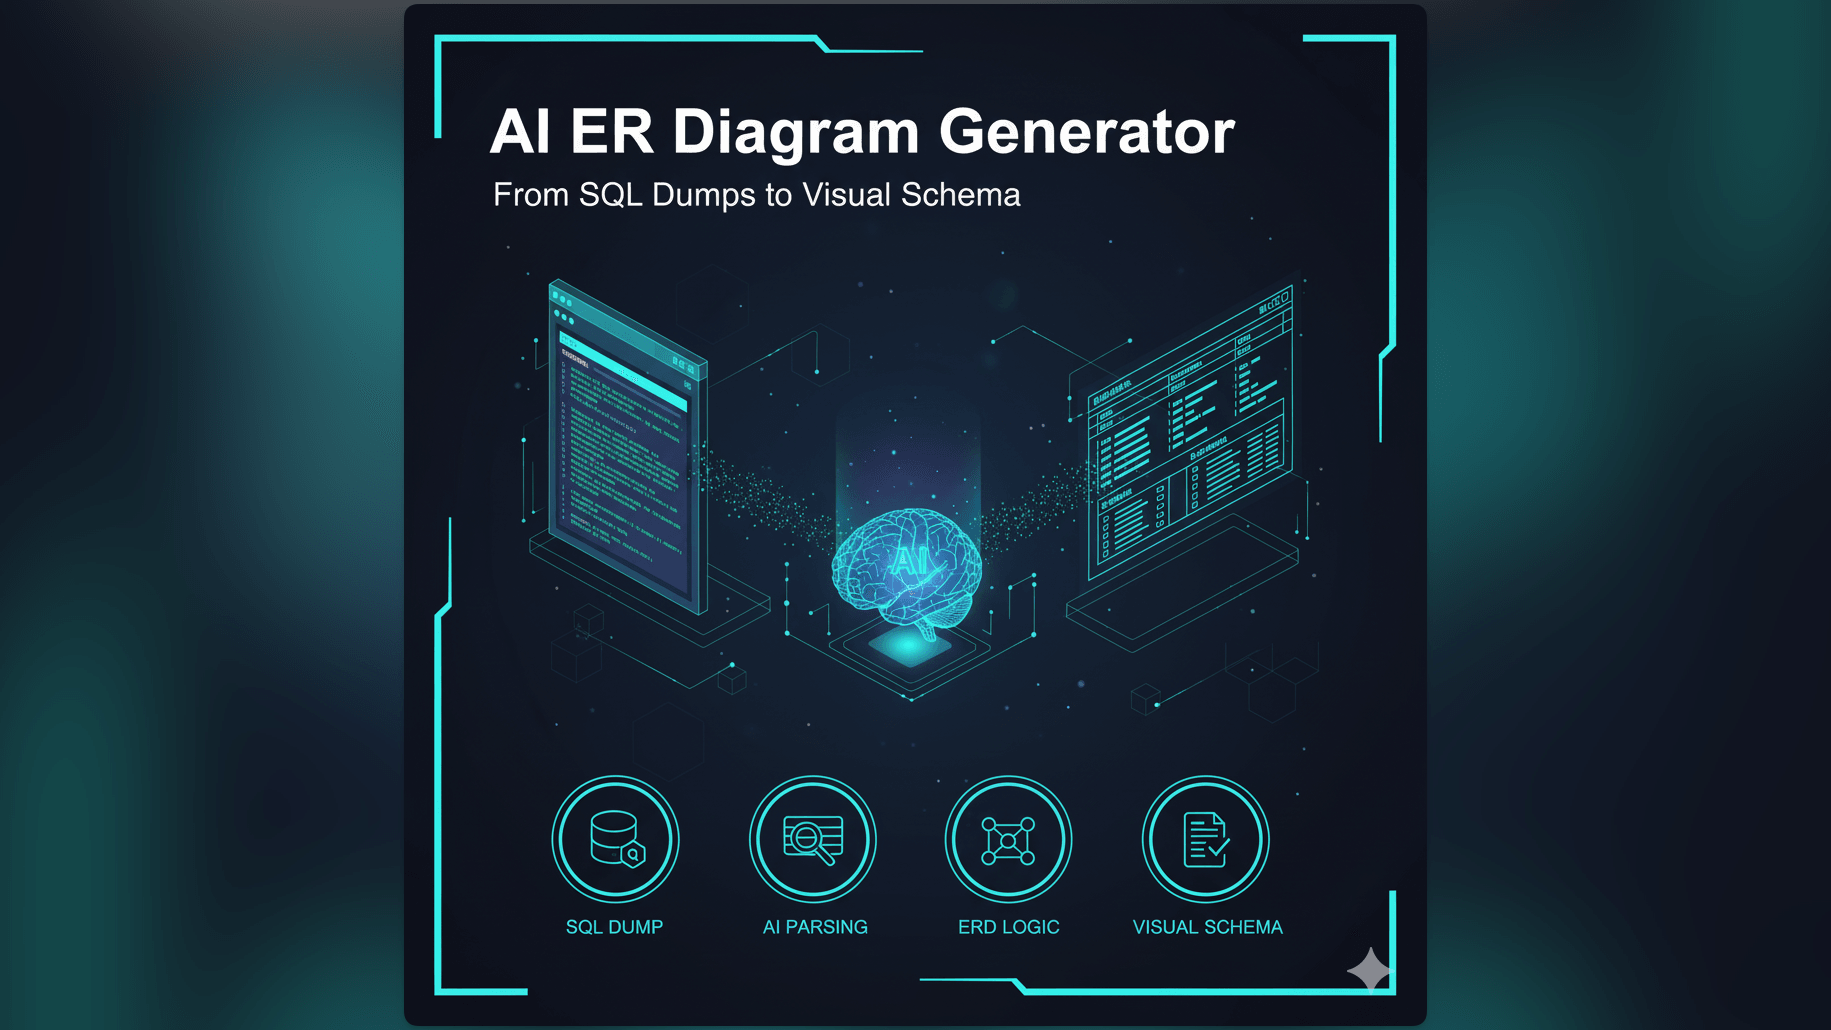
Introducing AI Diagram Maker: Your AI ER Diagram Generator for Legacy Systems
We believe that if the code exists, the diagram should exist. You shouldn’t have to draw what is already defined in the SQL.
Transform Raw SQL into a Visual ERD Instantly
AI Diagram Maker includes a parser specifically designed for SQL. It doesn’t just read the text: it understands the relational logic. It can read a CREATE TABLE statement and instantly verify the entity structure.
The “Import” Feature: Just Paste Your SQL Dump
You don’t need to describe the database in English. You can speak to the tool in its native language: SQL. We built an import feature that accepts raw SQL text. You can paste the messy 15,000 line file directly into the tool. We filter out the INSERT statements (the data) and focus purely on the CREATE statements (the structure).
Get an Immediate Overview: “I have an old SQL file, what does it look like?”
The goal is instant situational awareness. Within seconds of pasting the code, you get a visual representation. You go from “I have no idea what is in here” to “Oh I see. It is a star schema centered around the Transaction table.”
AI Diagram Maker Workflow: From SQL Dump to Visual ERD, Step-by-Step
Here is exactly how you would tackle that Friday afternoon request using our tool.
- Step 1: Copying Your Legacy SQL File Content: Open that scary
backup_prod_final.sqlfile. Select All. Copy. You don’t need to clean it up: our engine is robust enough to ignore comments and data dumps. - Step 2: Pasting into AI Diagram Maker: Go to AI Diagram Maker and select the ER Diagram mode. Paste the code into the prompt box.
- Step 3: AI Parses SQL and Generates the Diagram: Hit Generate. The AI scans the text, identifies every table, finds every Primary Key, and traces every Foreign Key constraint. It draws the boxes, the crow’s foot notation lines, and groups related tables.
- Step 4: Reviewing and Refining: Now you have a map. You can zoom in and identify main profile tables vs join tables. Use the chat to organize it: “Group the logging tables at the bottom” or “Highlight the tables related to Payment.”
The Output: A Clear, Comprehensive, and Editable Database Schema Visualization
The result is more than just a pretty picture.
- Instant Clarity on Tables and Relationships: You can clearly see the data types, nullable columns, and the cardinality of relationships (one-to-one vs one-to-many).
- Facilitates Easier Database Migrations: With this map, planning the migration is easy. You can identify which tables can be dropped and which ones are critical.
- A Foundation for Documentation: You have created the first piece of real documentation for this acquired company. Save this diagram to your wiki so the next developer doesn’t have to suffer.
Who Benefits Most from AI-Driven Database Reverse Engineering?
- Database Administrators: Visualize the sprawl of databases grown over ten years to find optimization opportunities.
- Software Developers: Understand the data model without reading the application source code.
- Data Analysts: Write better SQL queries because you can see the join paths visually.
- Solution Architects: Identify integration points and see exactly where to hook into the legacy system.
Ready to unlock your legacy databases? Experience the AI ER Diagram Generator. Turn that text into a map and get home on time. For more on the power of visual documentation, check out The Developer’s Guide to AI Diagramming.