· Comparisons · 8 min read
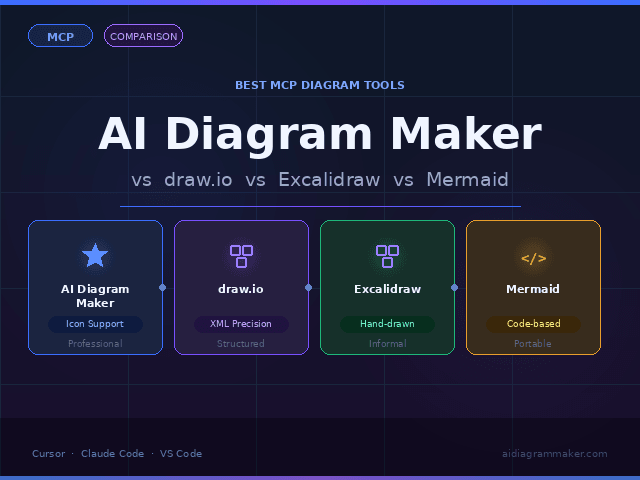
5 Reasons Developers Are Switching from Lucidchart to AI Diagram Maker
Manual diagramming tools like Lucidchart are slowing you down. Discover why developers are switching to AI diagram tools for speed, code integration, and automated maintenance.

For years, if you needed to make a diagram, the answer was pretty much Lucidchart. Let’s be fair, it was a huge step up. It took us from taking blurry photos of whiteboards and moved the whole process into the cloud. I’ve personally spent countless hours in it, dragging boxes, connecting lines, and getting things just right. And for a long time, it was the best we had. But the world of software development moves incredibly fast, and the tools we use have to evolve with it. The core way these manual tools work, the endless dragging and dropping, feels like it was built for a different era. For developers today, there’s a better way.
Tl;dr
Don’t have time for the full read? Here it is in a nutshell. Manual tools like Lucidchart are slow, create diagrams that are disconnected from your actual code, and lead to inconsistent messes. Developers are switching to AI-powered tools like AIDiagramMaker for five main reasons:
- Speed: Generating diagrams from text or code takes seconds, not hours.
- Accuracy: You can create diagrams directly from your code, making them a true reflection of your system.
- Consistency: An AI engine handles all the styling and layout, so every diagram is clean and professional.
- Developer Focus: It’s built with features developers actually need, like version control and GitHub integration.
- Maintainability: Updating a diagram is as easy as typing a sentence, which means documentation actually stays current.
Introduction: The Age of Manual Diagramming is Over
Lucidchart and its cousins absolutely had their moment. They digitized a manual process and made visual collaboration accessible to everyone. We should give them credit for that. They are great general purpose business tools for making an org chart or a simple flowchart.
But. And this is a big but.
The fundamental methodology, the one where you manually drag a square onto a canvas, then drag a circle, then draw a line to connect them, then spend five minutes trying to get that line perfectly straight… that process is not built for the speed of modern software development. It’s a bottleneck. It’s tedious. And for developers, whose most valuable asset is their time and mental focus, it’s a productivity killer.
A new category of intelligent, AI powered tools has emerged, and they are not just a small improvement. They represent a philosophical shift. Tools like AIDiagramMaker are solving the core frustrations that developers have silently put up with for years, making them a far superior choice for anyone who writes code.
Reason 1: Speed. From Hours of Dragging to Seconds of Describing
Let’s really think about the old process. You have an idea for a system flow you need to explain. First, you open Lucidchart. Then you have to find the right shape library. AWS icons? UML shapes? Basic flowcharts? You drag out a box. You type in it. You drag out another box. You type in that one. You select the line tool. You draw a connector. Oops, it’s not aligned right. You spend what feels like an eternity nudging it one pixel at a time. Now repeat that twenty times.
It’s slow. It’s manual. It’s a frustrating distraction from the actual work of thinking about the system’s logic.
Now, contrast that with the AI powered approach. You have the same idea. You open AIDiagramMaker and you just… type. You describe the system as if you were explaining it to a colleague.
Read More: Text-to-diagram and code-to-diagram workflows
“Create a sequence diagram for an eCommerce checkout process.”
Image note (UI example):
- Screenshot of a manual, drag-and-drop UI for building an itinerary. This illustrates the tedious, manual interactions that tools like Lucidchart require — perfect for contrasting with an AI-powered text-to-diagram workflow.
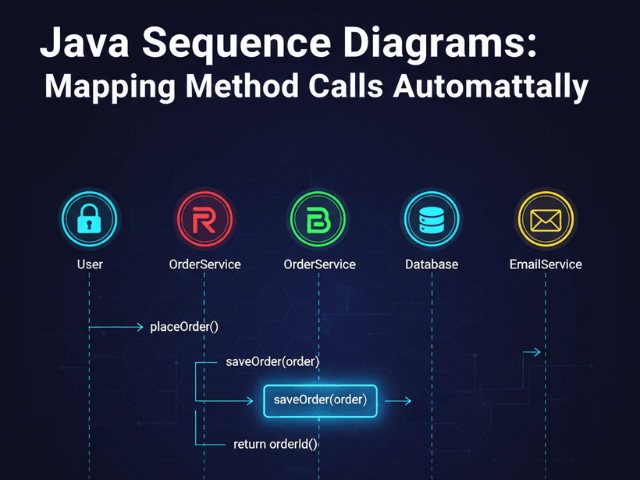
Image note (sequence diagram):
- A full sequence diagram for an eCommerce checkout process, showing actors (browser, cart, payment gateway), messages (validate cart, charge payment, persist order), and return flows. Use this to demonstrate how quickly a detailed, presentation-ready sequence can be generated from a single prompt.
And that’s it. A few seconds later, a clean, well structured, perfectly aligned diagram appears. It feels a bit like magic the first few times you do it. The sheer speed is a game changer. The time saved isn’t just about minutes or hours; it’s about maintaining your flow state. You can visualize an idea, share it, and get back to coding without the painful context switch of becoming a part time graphic designer.
Read More: Developer productivity
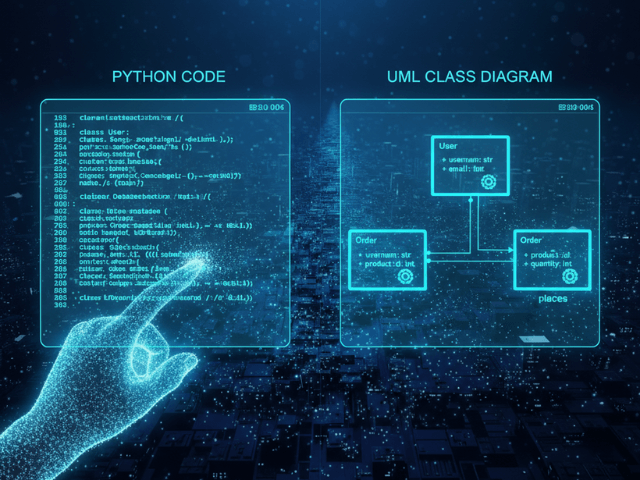
Reason 2: Code-to-Diagram. The Ultimate Source of Truth
This one is, I think, the most important reason for developers. A diagram made in Lucidchart is completely disconnected from your codebase. It’s an artistic interpretation of your system. It’s what someone thought the system looked like on a Tuesday six months ago. The moment a single line of code changes, that diagram begins its inevitable journey towards becoming a lie.
This is the root cause of so much outdated and untrusted documentation.
AI Diagram Maker fundamentally changes this relationship. It offers the ability to generate diagrams directly from your source code. You can point it at a GitHub repository, and it will analyze the code to produce an architecture diagram that reflects what is actually there.
This is a profound shift. Your documentation is no longer an approximation; it’s the ground truth. It’s not a drawing someone made based on memory. It’s a visualization of the living, breathing system. This moves diagrams from being a potential liability to a genuinely trustworthy asset for onboarding, code reviews, and system analysis.
Reason 3: Consistency. Perfect Layouts and Styling, Every Time
When you have a whole team of developers using a manual tool like Lucidchart, you inevitably end up with a visual mess. Every person has their own style. Sarah likes blue boxes, Tom prefers gray ones. One person uses rounded corners, another uses sharp. The spacing is different on every diagram. The font sizes are all over the place.
While this might seem like a minor cosmetic issue, it actually hinders communication. An inconsistent visual language makes documentation harder to read and look unprofessional. An AI diagramming tool acts as a built in designer and style guide for your entire team. The AI styling and layout engine doesn’t just throw shapes on a page. It analyzes the relationships and applies proven design principles to create a perfectly clean and readable layout. Every single time. It enforces consistency automatically. This means less time wasted on arguing over aesthetics and more time spent on the substance of the design.
Reason 4: Developer-Centric Workflow. Made for Builders.
Lucidchart is a general purpose business tool. It has to cater to marketers making funnels, HR making org charts, and consultants making process flows. Its features are, by necessity, a mile wide and an inch deep.
AI Diagram Maker, on the other hand, is built with a singular focus on the needs of developers and technical teams. It speaks their language. This is reflected in the features it prioritizes:
- A D2 Backend: The underlying diagram is represented as code, which developers understand and appreciate.
- Real Version Control: A git like history for every diagram, not just a simple undo button.
- GitHub Integration: The ability to connect directly to the place where developers live and work.
- Technical Diagram Support: It excels at creating the complex diagrams developers actually use, like UML, Sequence, and C4 architecture models.
It’s not that general tools are bad, of course, but for a specific and demanding audience like developers, a purpose built tool will almost always provide a better, more efficient experience.
Reason 5: Maintainability. Diagrams That Evolve with Your Project
This is the hidden killer of all documentation. The initial creation of a diagram can be a lot of work, but it’s the long term maintenance that is the real tax.
Imagine your architecture changes. A new microservice is being added. In Lucidchart, you have to open the old diagram, find a space for the new service, redraw half the connections, and manually realign everything to make it fit. The effort required is so high that most of the time, it just… doesn’t get done. This is how documentation dies.
With an AI powered tool, the process is completely different. You can simply use conversational editing. You open the existing diagram and type, “Add a ‘Notification Service’ that is called by the User API.” The AI understands the request and intelligently refactors the diagram for you.
Or even better, if your diagram was originally generated from your code, you just regenerate it after you’ve merged your changes. The documentation updates itself. This transforms maintenance from a massive chore into a trivial, automated step.
Feature Comparison Table: AIDiagramMaker vs. Lucidchart
| Feature | Lucidchart | AIDiagramMaker |
|---|---|---|
| Primary Input | Manual Drag & Drop | Natural Language & Code |
| Generation Speed | Slow (Manual) | Instant (AI) |
| Code Integration | None | Yes (GitHub Sync) |
| Layout/Styling | Manual & Inconsistent | Automatic & Consistent |
| Version Control | Basic / Limited | Advanced, Git-like History |
| Target Audience | General Business Users | Developers & Tech Teams |
Conclusion: It’s Time to Stop Drawing and Start Generating
To be clear, this isn’t about saying Lucidchart is a bad product. It was a fantastic solution for the problem it was designed to solve. It was a leap forward from the whiteboard.
But the nature of the problem has changed, at least for those of us building software. AI Diagram Maker represents the next quantum leap. It’s an intelligent tool built for a modern, automated, code-centric workflow.
The choice is becoming increasingly clear. You can continue with a manual tool from the past and accept the built in friction, speed limitations, and maintenance burden. Or you can embrace an automated, intelligent tool that is designed for the future of software development. It’s time to stop spending your valuable time aligning boxes. It’s time to start generating.