· Glossary · 6 min read
What is Diagram as Code
What is the meaning of Diagram as Code? A complete definition of the methodology that treats diagrams like software, enabling version control and automation.
I think we have all been there at some point. You are working on a project, and the documentation is trapped in some proprietary format. Maybe it is a Visio file from 2015. Maybe it is a binary blob that you cannot open because you do not have the paid license for the tool anymore.
It is frustrating.
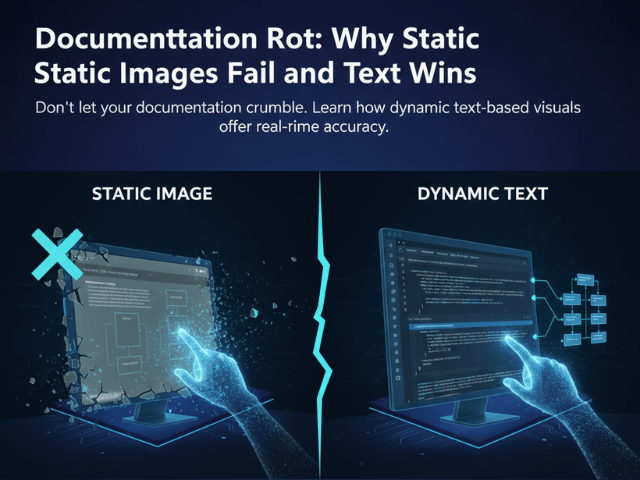
For the longest time, software documentation felt like it was stuck in the dark ages while the code itself moved forward. We had amazing tools for version control and collaboration for our code, but our diagrams were just static images floating around in folders.
Diagram as Code is the answer to that problem. It is a philosophy that says we should treat our system architecture drawings with the same respect and rigor that we treat our production code. It is about moving away from clicking and dragging and moving toward defining and describing.
TL;DR
- The Definition: Diagram as Code (DaC) means creating diagrams using text based code rather than drawing them manually in a graphical editor.
- The Big Benefit: Because the diagram is just text, you can store it in Git, version control it, and diff it just like any other source file.
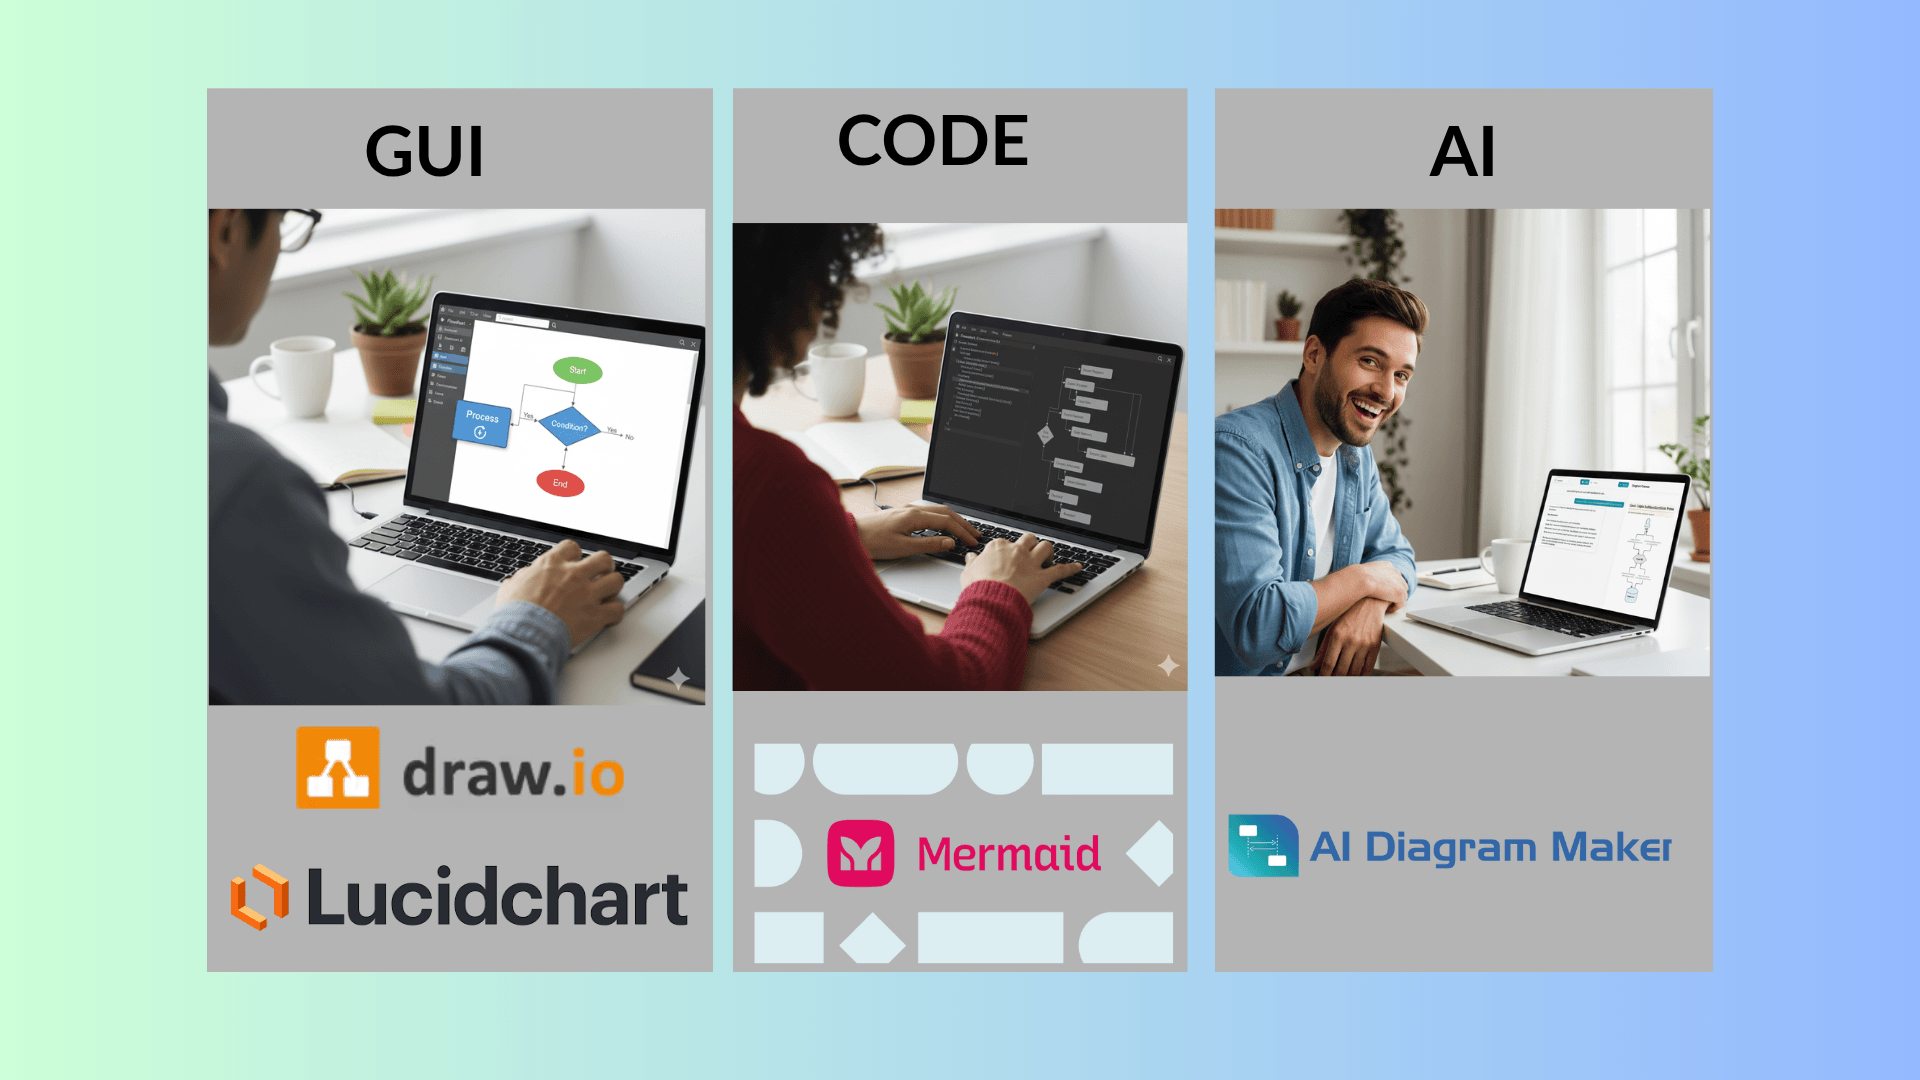
- The Workflow: You write a description in a language like Mermaid or D2, and a tool renders the visual image for you automatically.
- The Evolution: While it used to require learning complex syntax, modern AI tools now allow you to generate this “diagram code” using plain English.
Definition
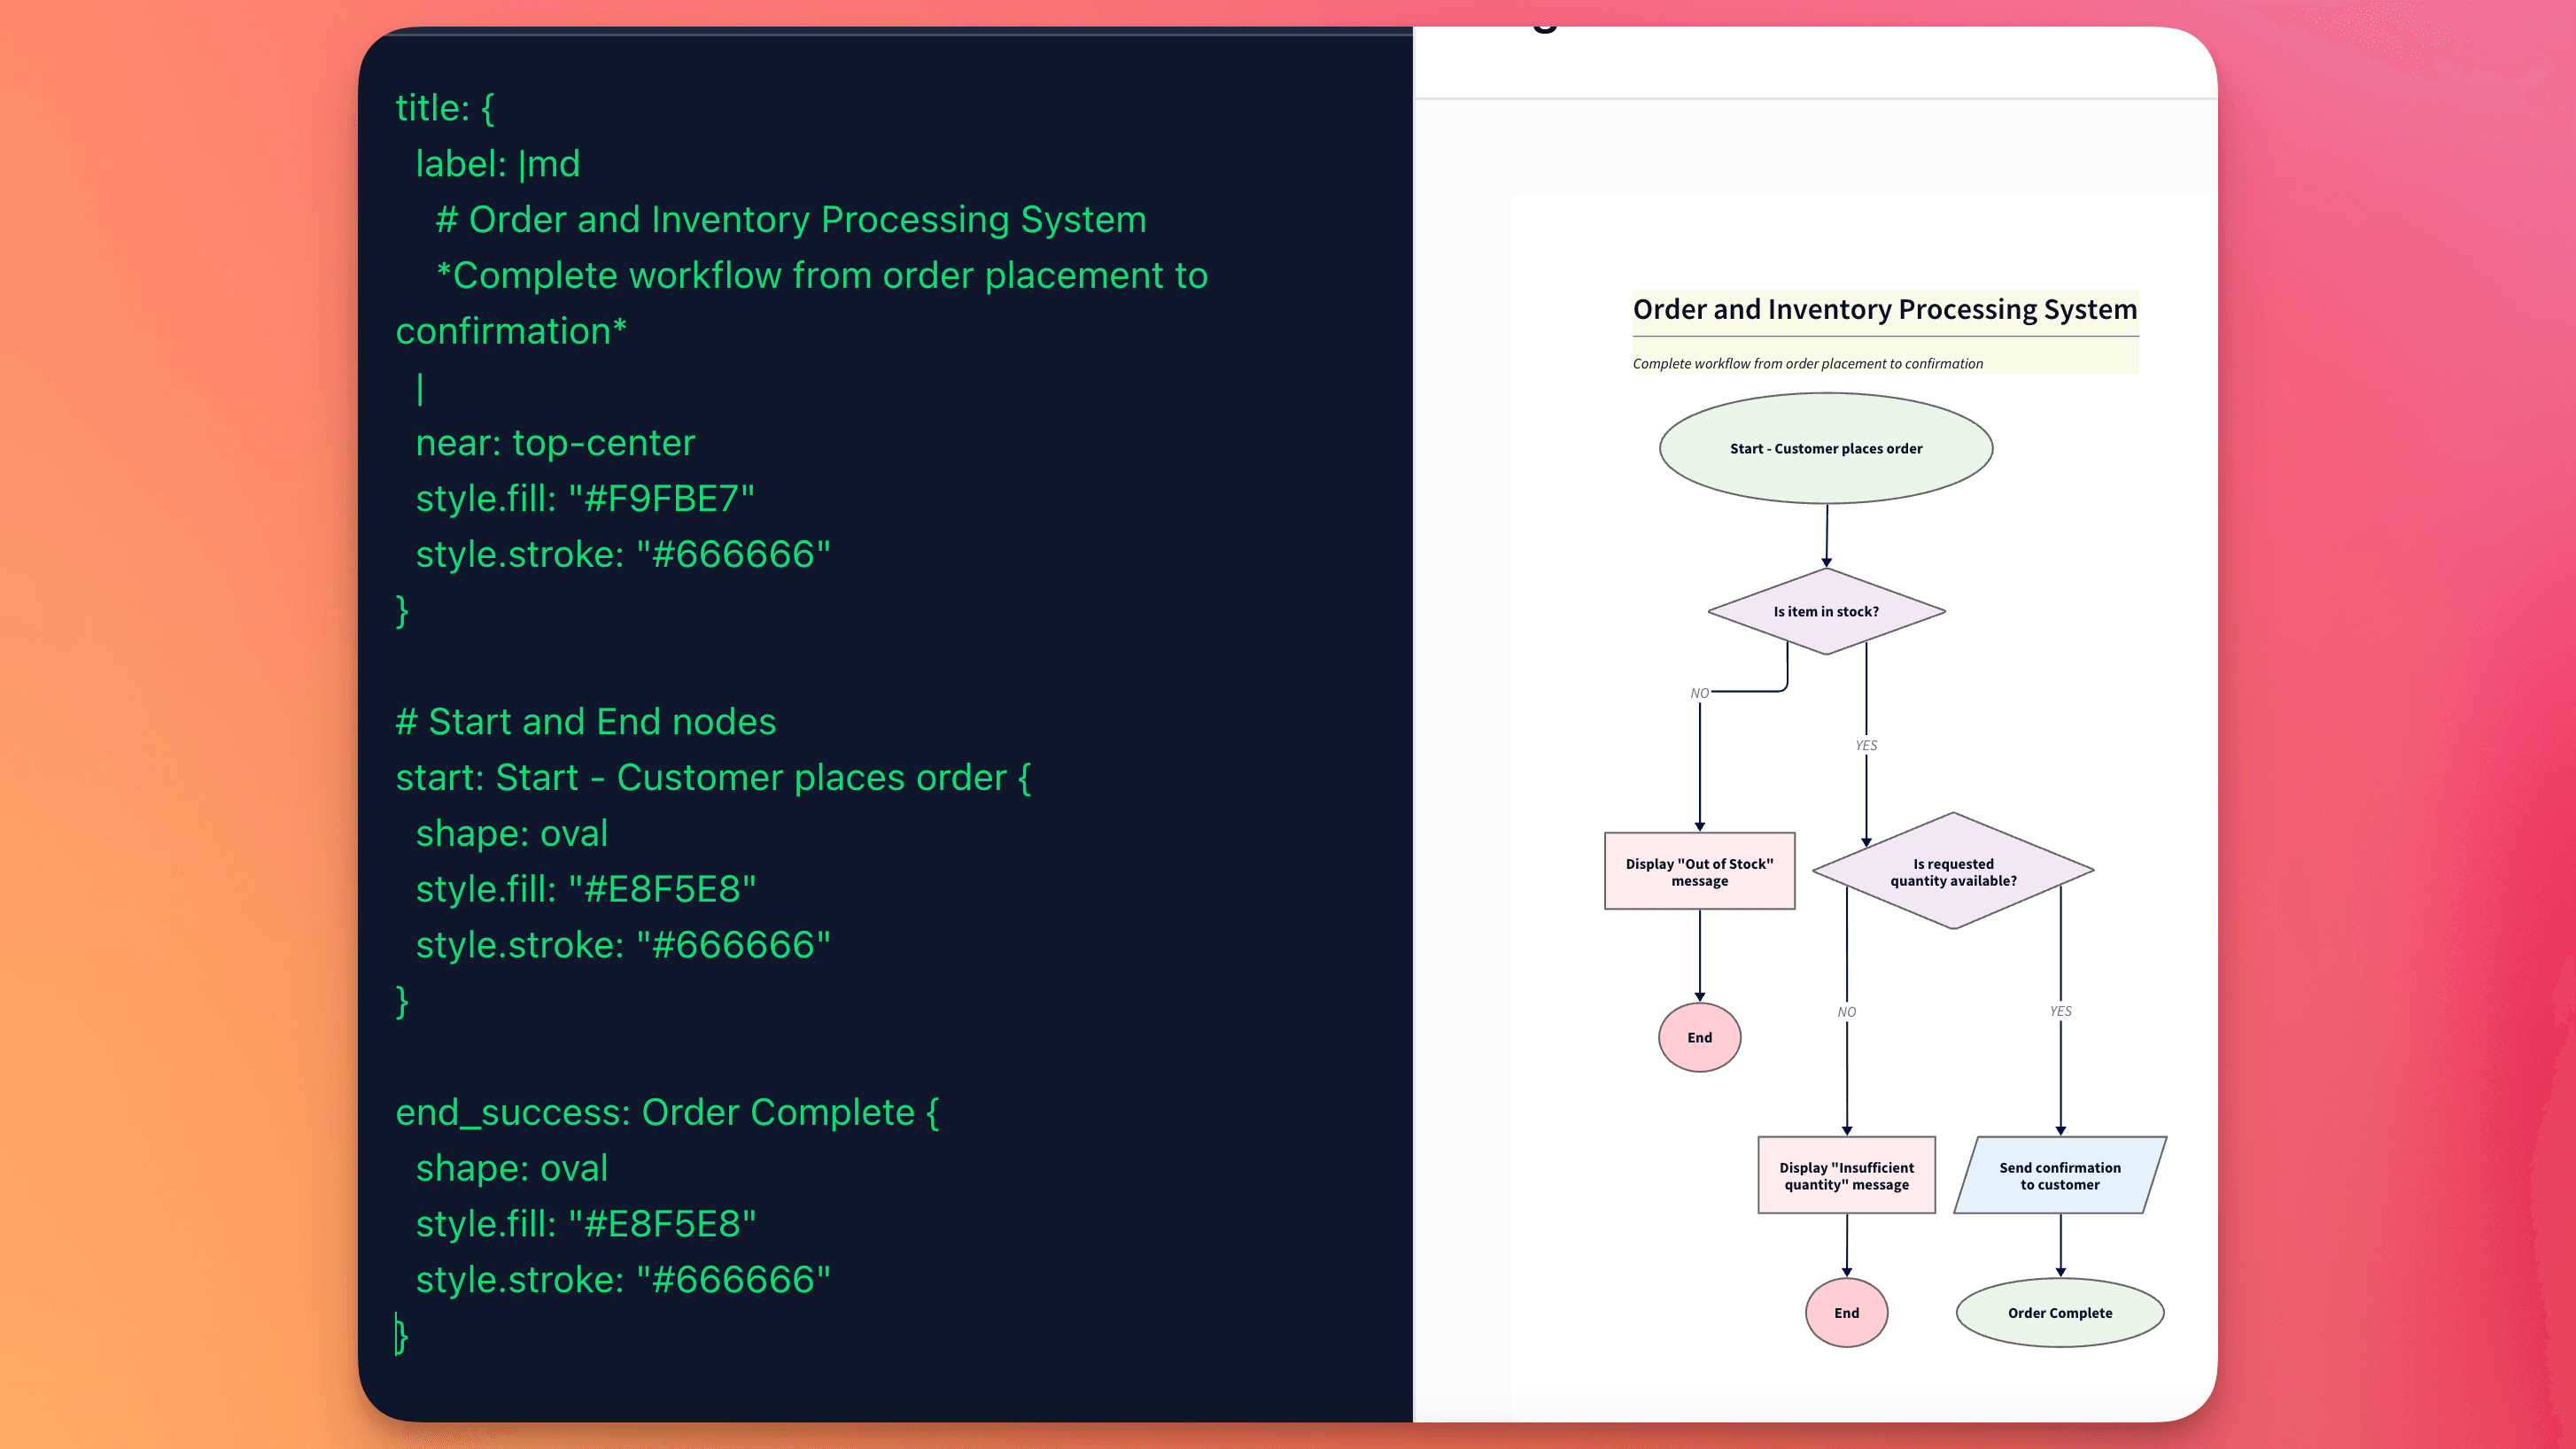
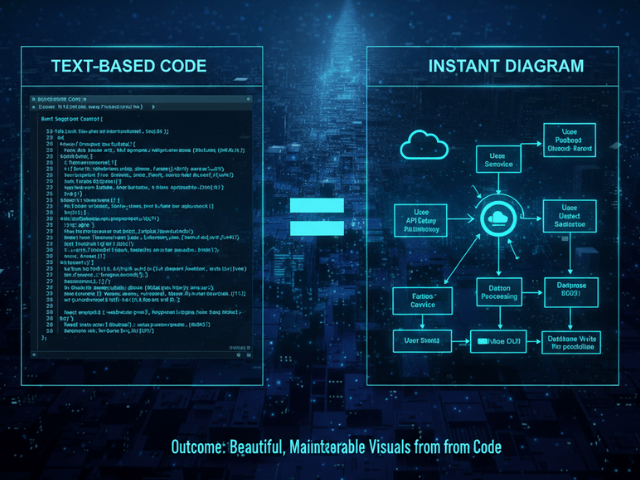
At its core, Diagram as Code is the practice of defining diagrams using plain text files.
Instead of opening a GUI tool and spending twenty minutes trying to get an arrow to snap to the center of a rectangle, you write a few lines of code. You might write something like User -> Database: Query.
Then, a rendering engine takes that text and draws the arrow for you.
This approach fundamentally changes the nature of the diagram. It stops being a “drawing” or an “artwork” and becomes a data artifact. It decouples the content of the diagram from the visual presentation. You define what connects to what, and the software decides how to show it.
It is a lot like HTML and CSS. You write the structure, and the browser handles the rendering.
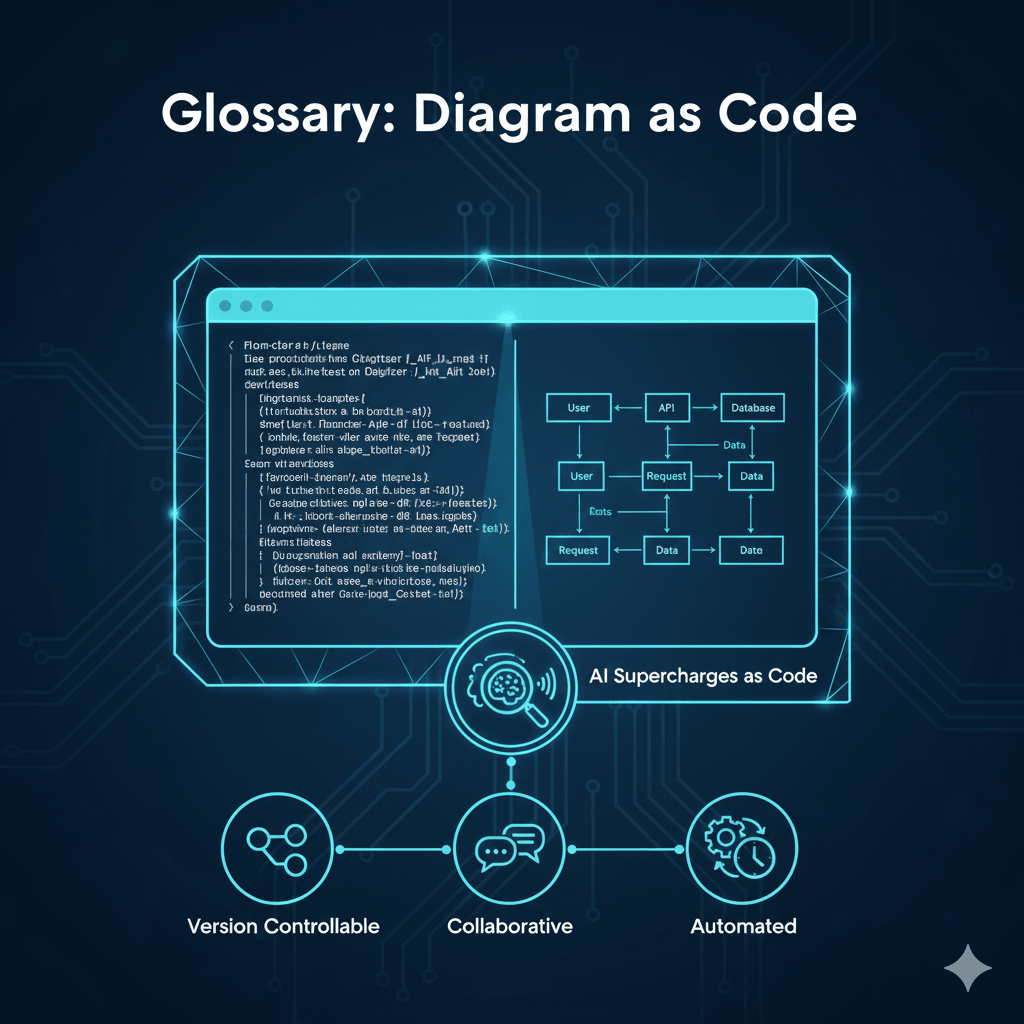
The Core Principles of Diagram as Code
This isn’t just about avoiding mouse clicks. It is about bringing engineering best practices into documentation. There are four main pillars that make this approach so powerful for developers.
1. Version Controllable
This is probably the biggest one for me.
If you have ever tried to merge a conflict on a PNG image or a proprietary save file, you know it is impossible. You just have to pick one version or the other. You cannot see what changed.
With Diagram as Code, your diagram is just a text file. If you change a line, Git tracks it. You can see a “diff” that shows exactly what changed. You can see that Bob changed the database connection from MySQL to PostgreSQL on Tuesday at 4 PM. You can revert changes if they break something. It integrates perfectly with the tools developers already use every single day.
2. Collaborative
Since the files are text, they live in your code repository. This means you can review them in Pull Requests.
Imagine this scenario. You are designing a new feature. You write the Diagram as Code file and open a PR. Your team member comments on line 14: “Hey, I think this service actually calls the cache first, not the database.”
You fix the line of text, push the commit, and the diagram updates. No screensharing required. No emailing updated JPEGs back and forth. It makes collaboration asynchronous and precise.
3. Automated
Once your diagram is code, you can automate it.
Since generating a new diagram takes only seconds, you can create fresh images every time you update your code. This ensures that the documentation in your README or your internal wiki is always using the latest version of the diagram, without the hassle of manual drawing.
You never have to worry about that “Architecture_v2_FINAL.png” file being outdated because you forgot to export the new one. The system builds the documentation for you.
4. Consistent and Reusable
I am not a designer. When I draw diagrams manually, they usually look terrible. The boxes are different sizes, and the colors clash.
With Diagram as Code, the rendering engine handles the styling. You can apply a global theme to all your diagrams. This means every flowchart and sequence diagram in your company documentation looks like it belongs to the same brand. It creates a professional standard without anyone needing to be good at graphic design.
How AI Supercharges Diagram as Code
So if this is so great, why isn’t everyone doing it?
Well, historically, there was a barrier. You had to learn the language.
Tools like PlantUML or Mermaid have their own syntax. It is not incredibly hard, but it is one more thing to learn. You have to remember if you use two dashes or three dashes to make a dotted line. You have to look up the documentation to remember how to group nodes together.
This is where Artificial Intelligence changes the game.
AI tools like AIDiagramMaker act as a translator. You do not need to know the syntax anymore. You can just use natural language. You can type “Create a sequence diagram where the user logs in and gets a token.”
The AI understands your intent and writes the Diagram as Code for you. It generates the correctly formatted text. You get all the benefits of the code based approach (versioning, consistency, automation) without the learning curve.
It is basically having a senior engineer sitting next to you who knows the syntax perfectly. You describe the plan, and they write the code.
Related Concepts to Explore
This is a deep topic, and it connects to a lot of other modern development practices. Here are a few things you might want to look into next.
D2 is the modern language that powers many of the best AI diagramming tools. It is designed to be readable by humans, not just machines.
Diagram as Code is a huge part of the “Living Documentation” movement. See how it fits into the bigger picture of keeping docs alive.
Head back to the main guide to see how all these pieces fit together.