· Tools & Productivity · 9 min read
AI Diagram Maker vs Draw.io (2025): Complete Comparison Guide
An in-depth comparison of AI Diagram Maker and Draw.io for technical diagramming. Compare text-based automation and version control vs visual editing and real-time collaboration through real-world use cases to find the right tool for your team.
In software development, diagrams are more than visuals—they’re essential for system design, architecture review, and team communication.
The right tool can drastically affect how fast teams can iterate, update, and maintain technical documentation.
This post compares two popular options:
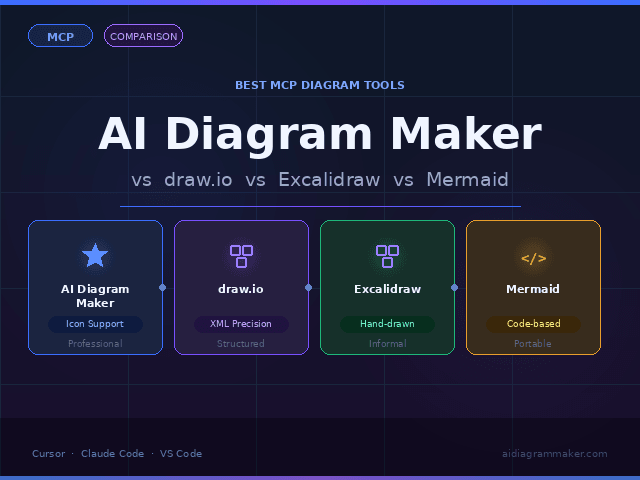
- AI Diagram Maker (ADM) — built on the text-based D2 language
- Draw.io (diagrams.net) — a mature, visual-first drag-and-drop editor
We’ll explore key differences, a real-world use case, and how each tool impacts workflow across productivity, collaboration, and maintainability.
TL;DR
AI Diagram Maker is best for developers who need speed, automation, and version control — create diagrams in 30 seconds with prompts, maintain them as code, and track changes in Git.
Draw.io excels at visual customization and real-time collaboration — perfect for presentation-ready diagrams and cross-functional teamwork.
Key metrics from our comparison:
- ⚡ 10-20x faster creation with AI Diagram Maker (30 seconds vs 5-10 minutes)
- 📝 Zero manual layout — auto-arranged with dagre/ELK engines
- 🔄 Version control friendly —
.d2text files vs XML - 🎨 Visual polish — Draw.io offers unlimited customization
- 👥 Collaboration — Draw.io supports real-time editing
Bottom line: Use AI Diagram Maker for technical docs that need frequent updates; use Draw.io for polished, collaborative visuals.
What Is AI Diagram Maker?
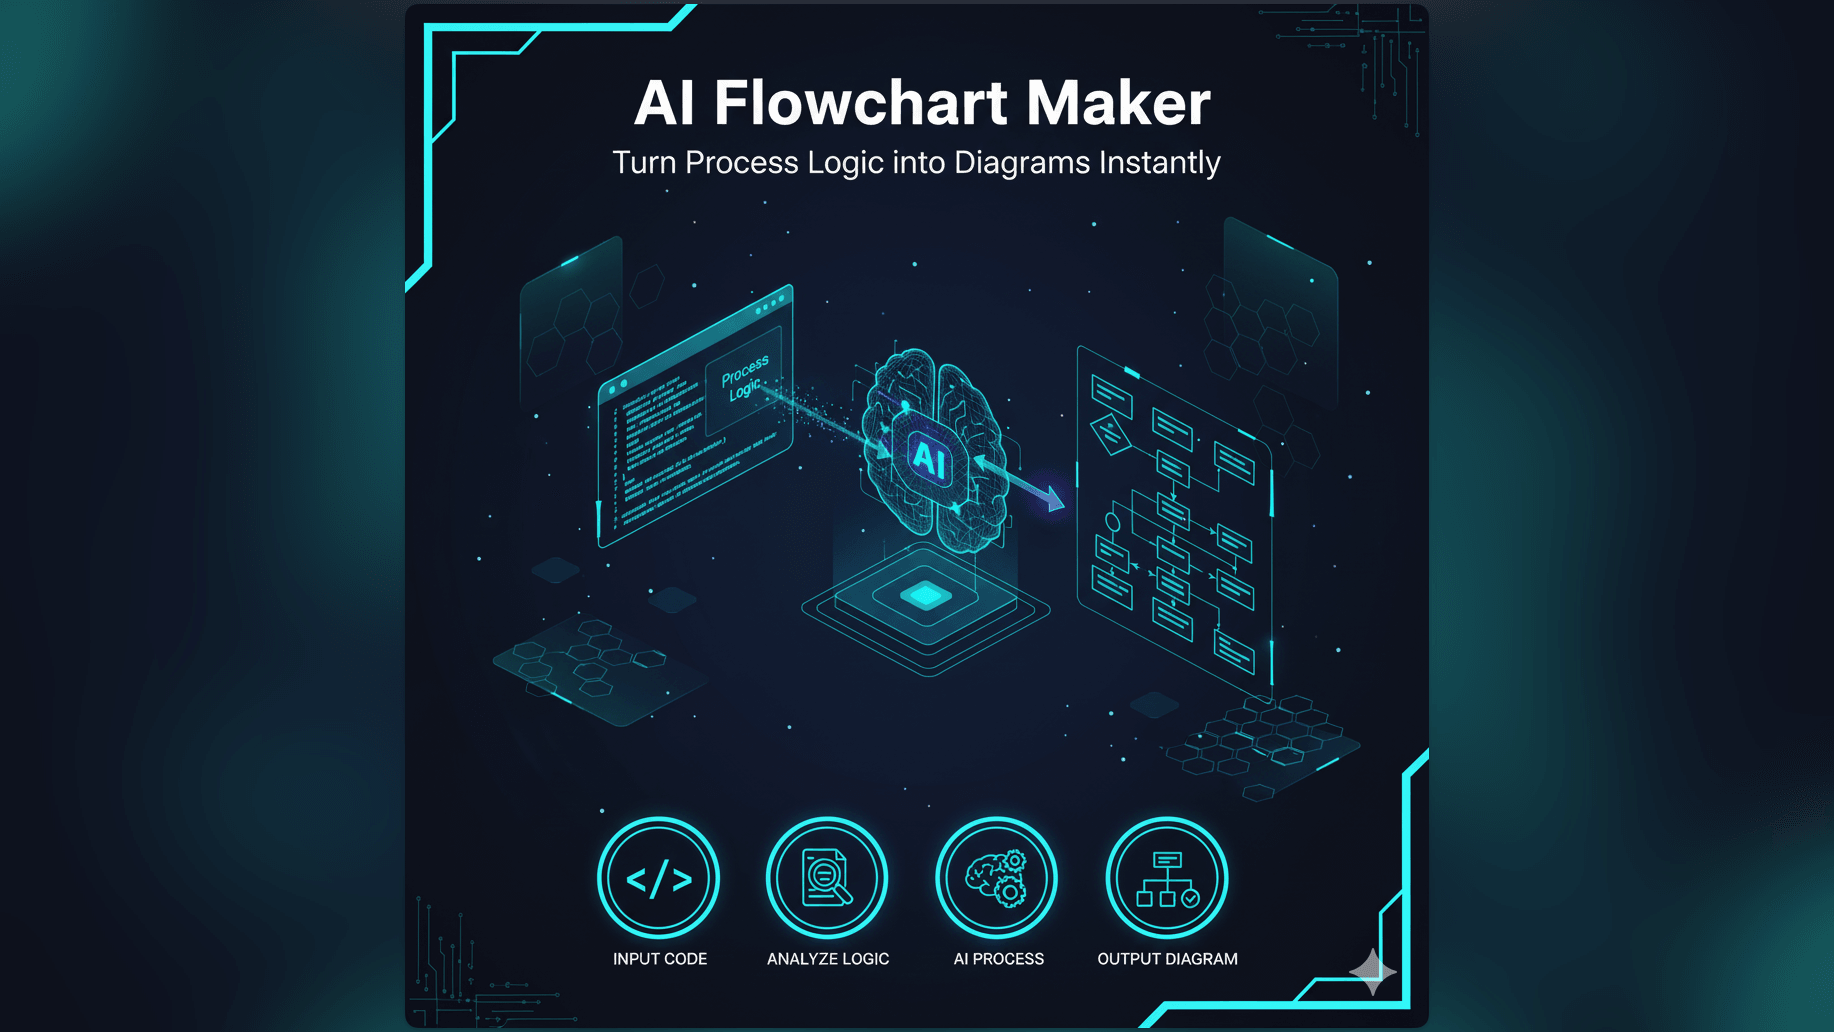
AI Diagram Maker (ADM) is a developer-friendly diagramming platform that lets you create complex visualizations using plain text or natural language prompts.
It’s powered by D2 — a declarative diagramming language by Terrastruct.
D2 automatically handles layout, spacing, and connections, making it ideal for architecture diagrams, workflows, and system designs.
Highlights
- Text or prompt-driven: Generate diagrams using natural language or D2 code
- AI assistance: Describe the system and let AI generate diagrams instantly
- Layout automation: Uses dagre, ELK, and other layout engines
- Version control ready: Text-based
.d2files are diffable and maintainable - Style consistency: Centralized theming for reusable design rules
In short, AI Diagram Maker helps developers create, version, and maintain diagrams without leaving their coding workflow.
What Is Draw.io?
Draw.io is a free, open-source, GUI-based diagramming tool loved for its simplicity and flexibility.
It provides a visual-first experience—perfect for quick ideation, drag-and-drop layouts, and visually rich documentation.
Notable Features
- VSCode & Confluence integrations
- Real-time collaboration (via Live Share or browser sessions)
- Template libraries for system, network, and UML diagrams
- Shape and color control for high-fidelity visuals
Draw.io’s strength lies in visual freedom and accessibility, making it great for non-technical contributors or design-oriented workflows.
Real-World Use Case: Web Application Architecture
Let’s walk through a practical scenario — creating a three-tier web application architecture with a frontend, backend API, and database layer.
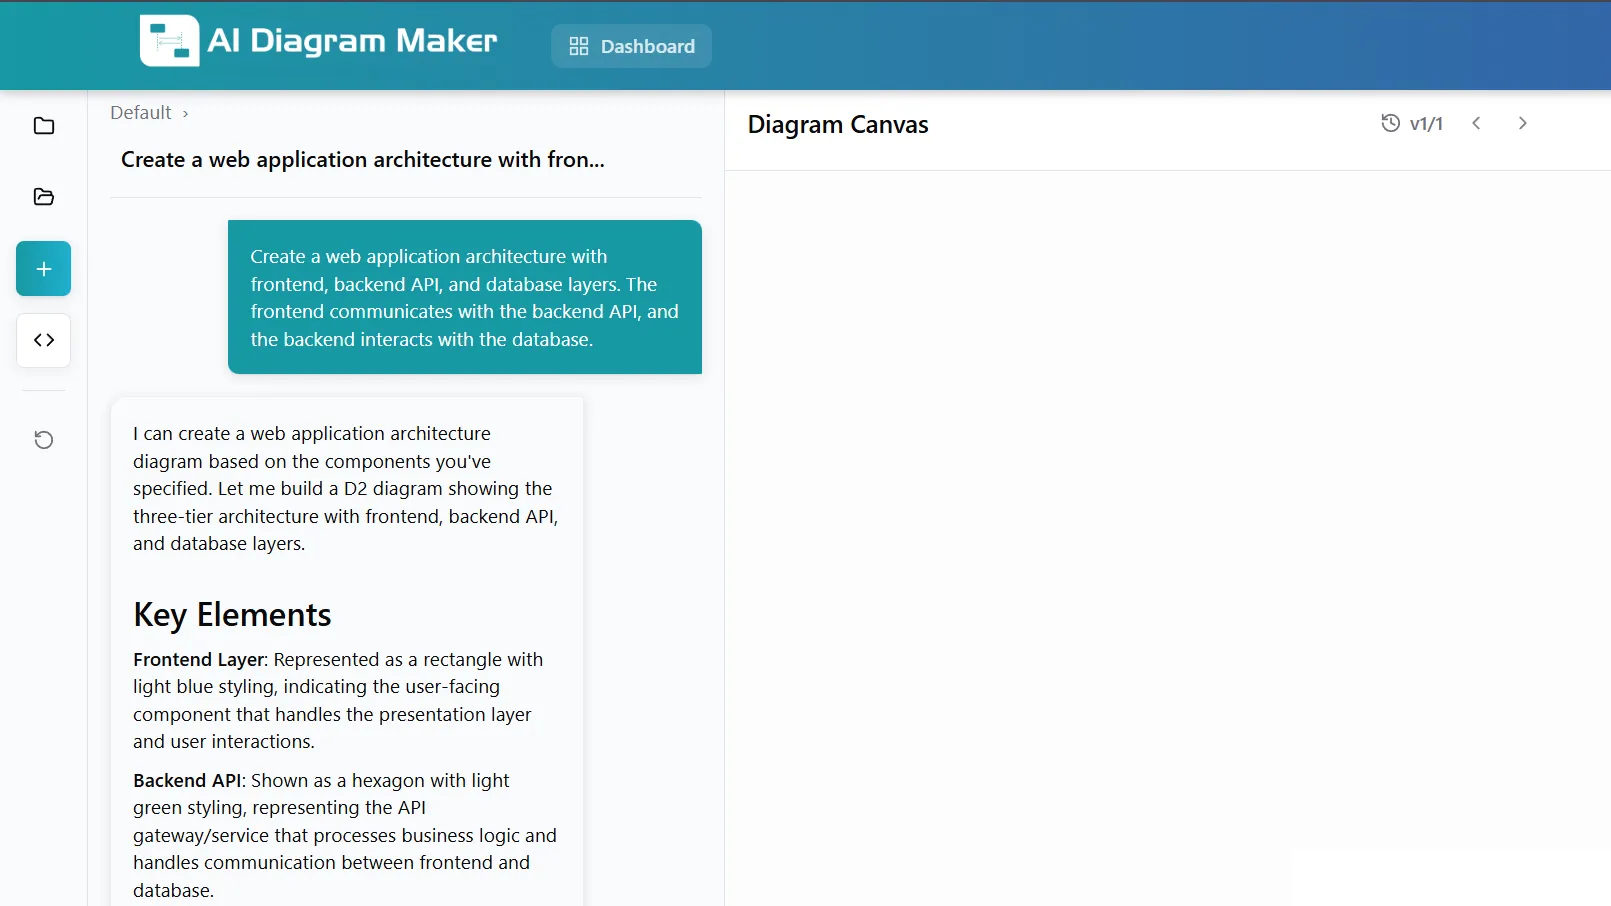
Step 1 — Generate Using AI Diagram Maker
Here’s the prompt used in AI Diagram Maker:
Prompt:
Create a web application architecture with frontend, backend API, and database layers.
The frontend communicates with the backend API, and the backend interacts with the database.
Using this simple prompt, AI Diagram Maker instantly generated the following diagram:
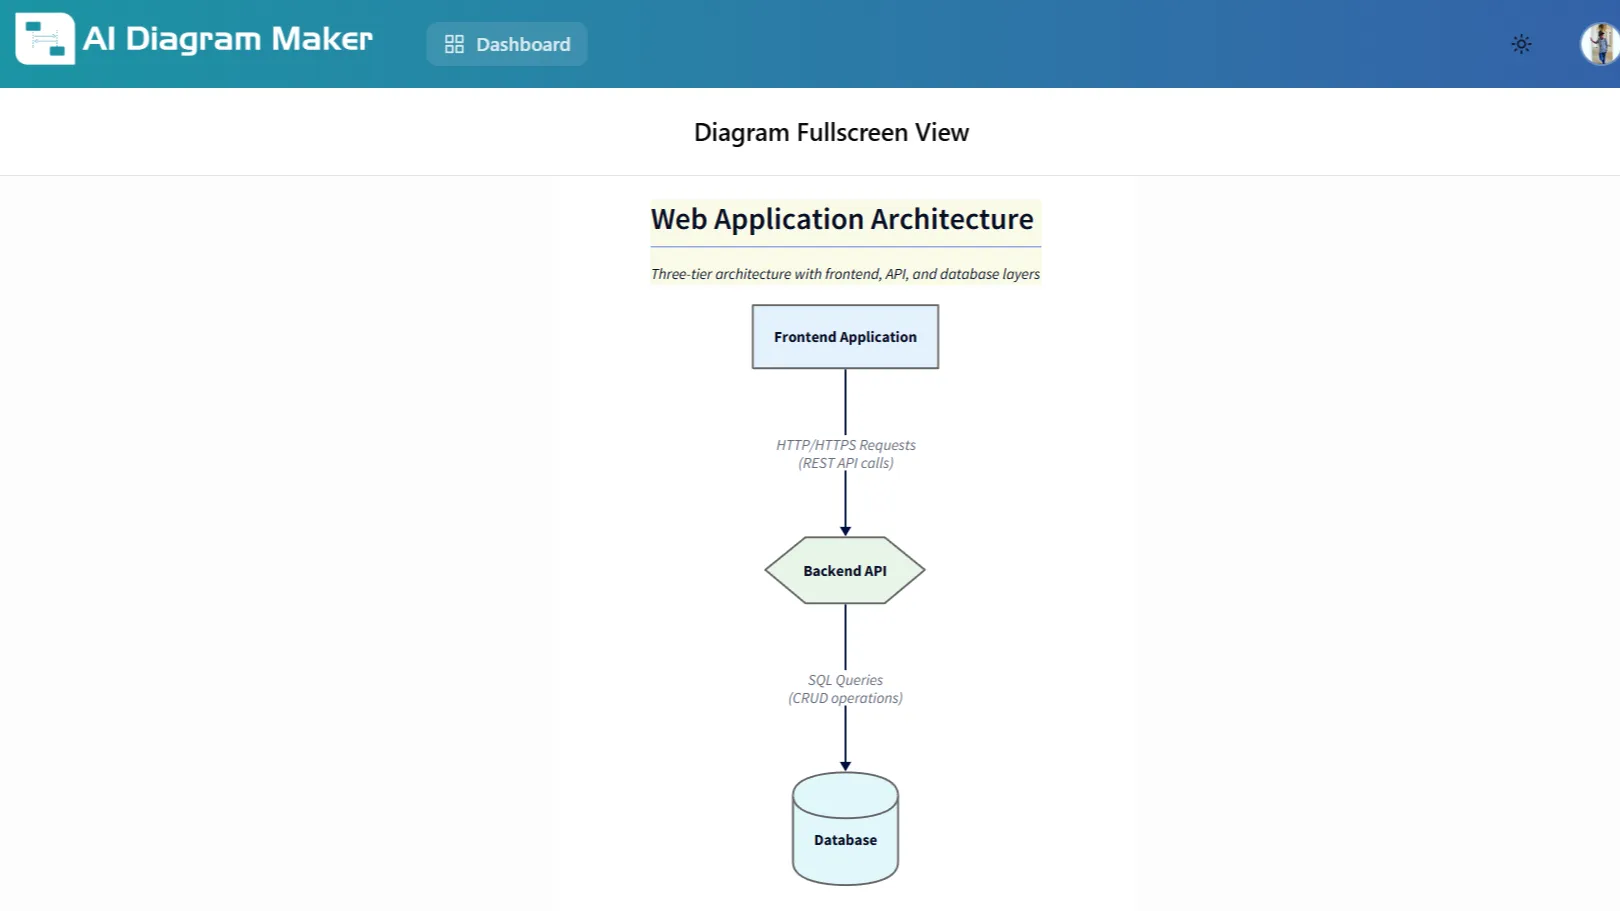
This output automatically handled:
- Layout and alignment (top to bottom flow)
- Shape selection (rectangle, diamond, and cylinder)
- Connection labels (“HTTP/HTTPS Requests”, “SQL Queries”)
- Style consistency (theme-based colors and fonts)
No manual drag or repositioning was required.
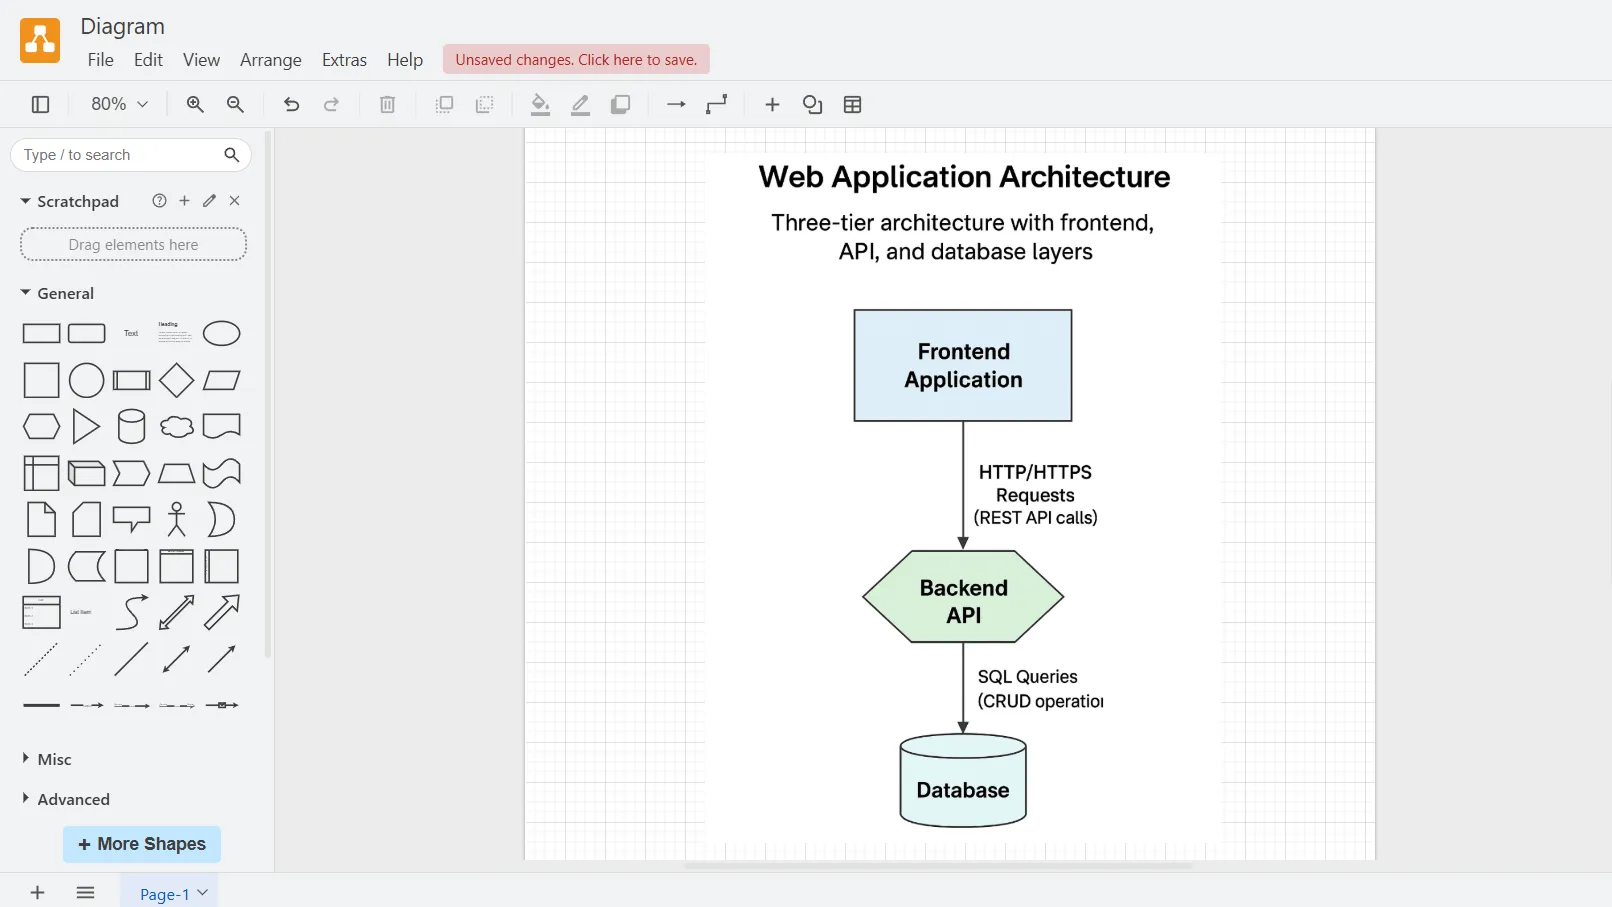
Step 2 — Create the Same Diagram in Draw.io
To recreate the exact same diagram in Draw.io, follow these steps:
Open Draw.io
- Go to https://app.diagrams.net
- Choose “Blank Diagram”
Add the main shapes
- From the General shape library:
- Drag a rectangle → label it Frontend Application
- Drag a diamond → label it Backend API
- Drag a cylinder → label it Database
- From the General shape library:
Arrange vertically
- Position the shapes in a vertical order (Frontend → Backend → Database)
- Use gridlines for alignment.
Add connectors
- Use the arrow connector tool:
- Frontend → Backend
- Backend → Database
- Double-click arrows to label them:
- “HTTP/HTTPS Requests (REST API calls)”
- “SQL Queries (CRUD operations)”
- Use the arrow connector tool:
Style manually
- Frontend Application → light blue fill
- Backend API → light green fill
- Database → light cyan fill
- Adjust font to bold headings.
Add title and subtitle
- Insert a text box at the top:
- Title: Web Application Architecture
- Subtitle: Three-tier architecture with frontend, API, and database layers
- Insert a text box at the top:
Save or export
- File → Export as → PNG or SVG
Step 3 — Comparison: AI Diagram Maker vs Draw.io for This Use Case
| Criteria | AI Diagram Maker | Draw.io | Verdict |
|---|---|---|---|
| Creation Time | 30 seconds using a prompt | 5–10 minutes of manual work | AI Diagram Maker – Faster setup |
| Ease of Alignment | Auto-arranged and styled | Manual alignment needed | AI Diagram Maker – Auto layout |
| Customization | Limited but consistent styles | Full control over shapes/colors | Draw.io – More flexibility |
| Labels and Connections | Auto-generated with arrows | Manual connector labeling | AI Diagram Maker – Automatic |
| Version Control | .d2 text file (diffable) | .drawio XML (hard to diff) | AI Diagram Maker – Developer-friendly |
| Collaboration | Asynchronous via PRs | Real-time collaborative editing | Draw.io – Better teamwork |
| Learning Curve | Prompts are intuitive; D2 knowledge only needed for code customization | Instinctive GUI use | Draw.io – Easier start |
| Iteration Speed | Edit prompt or code → instant update | Manual adjustments per change | AI Diagram Maker – Faster edits |
| Visual Polish | Clean but theme-limited | Highly customizable visuals | Draw.io – Presentation-ready |
Summary:
- Quick development & maintainability → AI Diagram Maker wins.
- Visual customization & collaboration → Draw.io wins.
Key Productivity Takeaways
1. Effortless Editing and Updates
In AI Diagram Maker, updating diagrams is as simple as editing text. Rename “API Server” to “Backend API” in one line, and the entire diagram refreshes instantly—no dragging, repositioning, or realigning shapes. This text-based approach makes iterations lightning-fast compared to manual visual editing.
2. Keep Diagrams in Sync with Code
With AI Diagram Maker, you can generate diagrams directly from your codebase, which fundamentally solves the diagram drift problem. When diagrams are created from actual code structure, they stay in sync with your implementation—no manual updates required.
Why it works:
- Auto-sync with code: Generate diagrams from source code using AI prompts, ensuring diagrams reflect the current architecture
- Version controlled:
.d2files live alongside your code in Git, so diagram changes are tracked, reviewed, and versioned with every commit - Easy updates: When architecture changes, regenerate the diagram in seconds rather than hunting for outdated shapes in a visual editor
Traditional visual editors like Draw.io require manual updates whenever code changes, leading to stale documentation. With code-driven diagramming, your documentation evolves automatically as your system grows.
3. Dramatic Time Savings
The comparison shows a 10-20x time advantage for initial creation: 30 seconds with AI Diagram Maker versus 5-10 minutes in Draw.io. For teams creating multiple diagrams weekly, this translates to hours saved—time better spent on actual development rather than manual shape positioning.
4. Zero Layout Effort
AI Diagram Maker’s automatic layout engines (dagre, ELK) eliminate the tedious work of aligning, spacing, and organizing elements. You describe the structure, and the tool handles the visual arrangement—freeing you from the cognitive load of “design thinking” when you just need clear documentation.
5. AI-Powered Acceleration
Natural language prompts mean you can generate complex architecture diagrams without learning specialized syntax. Simply describe your system in plain English, and AI translates your intent into properly structured diagrams—lowering the barrier for quick documentation and rapid prototyping.
When to Use Each Tool
Choose AI Diagram Maker When:
- You need speed: Generate diagrams in seconds, not minutes—ideal when documentation needs to keep pace with development
- Diagrams change frequently: System architecture evolves rapidly and you need instant updates without manual repositioning
- Version control matters: Track diagram changes alongside code in Git with meaningful diffs and PR reviews
- You value automation: Let AI and layout engines handle the tedious work of alignment, spacing, and visual organization
- Developer-first workflow: You prefer typing text or prompts over dragging shapes, and want diagrams that live as code
Best for: Technical architecture docs, API documentation, system design reviews, CI/CD pipeline diagrams, developer wikis
Choose Draw.io When:
- Visual customization is critical: You need pixel-perfect control over colors, fonts, shapes, and styling for presentations
- Real-time collaboration needed: Multiple team members need to edit the same diagram simultaneously
- Non-technical stakeholders are involved: The intuitive GUI makes it accessible for product managers, designers, or executives
- One-off diagrams: Quick standalone diagrams that won’t need frequent updates or version tracking
- Visual brainstorming: Whiteboard-style sessions where freeform creativity matters more than maintainability
Best for: Client presentations, product roadmaps, workshop sessions, marketing materials, cross-functional team collaboration
Hybrid Approach: Best of Both Worlds
For teams wanting maximum flexibility:
- Start with AI Diagram Maker — generate the base structure using prompts or D2 code
- Export as SVG — get a clean, scalable vector output
- Polish in Draw.io — add final visual touches, custom branding, or presentation styling
- Maintain the
.d2source — keep it version-controlled for future updates
This workflow gives you the speed and maintainability of code with the visual polish of a GUI editor.
Frequently Asked Questions (FAQ)
Which tool is faster for creating diagrams?
AI Diagram Maker is 10-20x faster for initial creation. Our comparison showed 30 seconds with AI Diagram Maker versus 5-10 minutes in Draw.io for the same three-tier architecture diagram. The speed advantage comes from AI-powered generation and automatic layout engines.
Can I use both tools together?
Yes, and many teams do. The recommended workflow is:
- Generate base structure in AI Diagram Maker using prompts
- Export as SVG for high-quality vector output
- Add final visual polish in Draw.io for presentations
- Keep the
.d2source file version-controlled for future updates
This gives you automation and maintainability from AI Diagram Maker, plus visual customization from Draw.io.
Which tool is better for version control?
AI Diagram Maker is far superior for version control. It uses plain-text .d2 files that integrate seamlessly with Git—you get meaningful diffs, PR reviews, and proper change tracking. Draw.io uses XML-based .drawio files that are difficult to diff and merge, making collaboration through version control systems challenging.
Which has a steeper learning curve?
Draw.io is easier to start with for most users—the drag-and-drop interface is intuitive and requires no learning. AI Diagram Maker is also beginner-friendly if using natural language prompts, but learning D2 syntax for advanced customization requires some investment. However, the productivity gains often justify the learning curve for technical teams.
Are both tools free?
Yes, both are free to use:
- Draw.io is completely free and open-source
- AI Diagram Maker offers a free tier with generous limits; paid plans add advanced AI features and priority processing
Which tool handles diagram updates better?
AI Diagram Maker is dramatically faster for updates. Change a variable name or restructure your architecture? Edit a few lines of text or regenerate from a new prompt—done in seconds. Draw.io requires manually finding, moving, and reconnecting shapes, which becomes increasingly time-consuming as diagrams grow in complexity.
Which tool supports real-time collaboration?
Draw.io has superior real-time collaboration with simultaneous multi-user editing through browser sessions or VSCode Live Share. AI Diagram Maker uses asynchronous collaboration through Git PRs and code reviews, which works better for developer workflows but isn’t truly “real-time.”
Is AI Diagram Maker only for developers?
Primarily yes—AI Diagram Maker is designed for developer-first workflows. However, anyone comfortable with basic text editing or natural language prompts can use it effectively. Draw.io is more accessible for non-technical stakeholders, designers, and product managers.
Conclusion
The choice between these tools isn’t about which is “better”—it’s about which fits your workflow.
Start with AI Diagram Maker if you’re a developer needing fast, maintainable, version-controlled technical documentation.
Choose Draw.io if you need visual perfection and real-time collaboration with non-technical teams.
Use both for the ultimate workflow: code-driven speed + visual polish.
Ready to experience 10x faster diagramming?
👉 Try AI Diagram Maker now