· Developer Tools · 12 min read
AI Flowchart Maker: Turn Process Logic into Diagrams Instantly
Stop pushing pixels and start designing logic. Learn how an AI flowchart maker transforms text descriptions into professional process diagrams in seconds, saving hours of manual work.
I want you to think about the last time you had to create a flowchart. Maybe it was for a new user onboarding sequence. Maybe it was to document a messy API integration that kept failing in production. You probably opened a traditional diagramming tool. You saw a blank white grid. You dragged a rectangle onto the canvas. You typed “Start.” Then you dragged a diamond shape for a decision. You spent thirty seconds trying to get the arrow to connect straight.
Two hours later you had a diagram. It looked okay. But then you realized you missed a critical “If/Else” condition right at the beginning. To fix it you had to select every single box and move them down two inches. The alignment broke. The arrows went haywire. You probably sighed and thought that there has to be a better way to do this.
We built AI Diagram Maker because we believe there is a better way. We believe that as developers and product managers your job is to design the logic, not to push pixels around a canvas. This guide explores how an ai flowchart maker changes the game by letting you turn your raw process logic into professional diagrams instantly.
The Core Problem: Flowcharts Are Essential, Manual Creation Is a Bottleneck
Flowcharts are arguably the most important documentation tool in software development. They are the bridge between abstract code and human understanding. When you need to explain how a billing system handles a failed payment, a Process Flow Diagram (PFD) is worth a thousand lines of code.
But creating them manually is a massive bottleneck. It creates a friction that actually discourages documentation.
Why Developers and PMs Need Clear Flowcharts
If you are building complex systems, clarity is your most valuable asset. A clear flowchart exposes logic errors before you write a single line of code. It helps Product Managers visualize user journeys to find dead ends. It helps developers understand the sequence of events in a distributed system.
Without flowcharts we are often coding in the dark. We assume we know how the system behaves but we miss the edge cases. A visual representation forces you to confront those edge cases. What happens if the API times out? What happens if the user is already logged in? A flowchart makes these questions visible.
The Time Sink of Dragging and Dropping Elements
The problem isn’t the flowchart itself. The problem is the tool you use to make it. Traditional tools treat diagramming like drawing. They force you to worry about the size of the box, the color of the border, and the straightness of the line.
This is cognitive load that has nothing to do with the problem you are solving. Every minute you spend resizing a decision diamond is a minute you are not thinking about your product. For a senior engineer or a busy founder, this time adds up. We estimate that with manual tools about 30% of your time is spent on logic and 70% is spent on formatting. That ratio is backwards.
The Pain of Updating Manual Flowcharts as Logic Evolves
Software is living and breathing. It changes constantly. You add a new feature. You change a database schema. You refactor a microservice.
When the code changes, the documentation must change too. But if updating your flowchart involves twenty minutes of painful drag and drop rearrangement, you simply won’t do it. The diagram becomes outdated. It becomes a relic.
This is the “documentation rot” that plagues almost every engineering team. An outdated flowchart is often worse than no flowchart at all because it gives you a false sense of confidence. You build against the diagram only to realize too late that the production system works differently.
Introducing AI Diagram Maker: Your Smart Text to Flowchart AI Solution
We took a step back and asked a simple question. What if you could just describe the flowchart? What if you could speak the logic and let a machine handle the drawing?
This is what AI Diagram Maker does. It is an intelligent engine that understands process logic. It takes your text input, whether it is a rough note or a detailed specification, and it constructs the visual diagram for you.
Describe Your Logic, Get a Flowchart: The Simplicity of AI
The workflow is radically different from what you are used to. You don’t start with a palette of shapes. You start with a text box.
You might type something like this:
“The user opens the app. Check if they have a valid token. If yes go to the dashboard. If no show the login screen. On the login screen if they click ‘Forgot Password’ start the recovery flow.”
That is it. You don’t need to know which shape represents a “Process” or which shape represents a “Decision.” You just express the logic in natural language. The AI parses your sentences. It identifies the actors, the actions, and the conditions. It builds the nodes and routes the edges automatically.
How Our AI Flowchart Maker Works: From Prompt to Diagram
Under the hood we use advanced language models to interpret the structure of your request. We look for keywords that indicate flow. Words like “if,” “then,” “else,” “loop,” and “while” act as triggers for our engine.
Once we understand the logical structure, we apply graph layout algorithms to position the elements. We ensure that the main flow goes from top to bottom or left to right. We ensure that decision branches are clearly separated. We handle the routing of arrows so they don’t overlap messy.
The result is a professional vector diagram generated in seconds. It looks like you spent hours aligning it in Visio but it took you thirty seconds to type the prompt.
Key Advantage: Focus on Logic to Flowchart Not Drawing
The biggest shift here is mental. When you use AI Diagram Maker, you stop thinking like a designer and start thinking like an architect.
You are focused entirely on the logic to flowchart translation. You are looking at the output and asking “Is this flow correct?” rather than “Is this box centered?”
If you spot a logic error, you don’t grab a mouse. You just tell the AI to fix it. “Actually add a step before the dashboard to check for pending notifications.” The AI inserts the step and automatically rearranges the entire diagram to accommodate it. It is fluid. It is fast. It feels like coding but for visuals.
Real-World Use Cases for AI-Generated Flowcharts
We designed this tool for technical people. While it can certainly make a flowchart for planning a pizza party, its real power shines when you throw complex technical challenges at it. Here is how our users are deploying it in the wild.
Mapping User Onboarding Flows for SaaS Products
User onboarding is notoriously tricky. It is never a straight line. You have email verification loops. You have A/B tests. You have “skip for now” options. You have error states for taken usernames.
Trying to keep this all in your head is impossible. Scenario: Mapping a User Registration Logic shows how a product manager can use our tool to map this out. They can iterate rapidly. “What if we move the credit card requirement to after the trial starts?” They type the change and the flowchart updates instantly. This allows teams to prototype user journeys at the speed of conversation.
Visualizing Complex API Request-Response Cycles
Backend development involves a lot of invisible handshakes. Client sends request. Server authenticates. Server queries database. Database returns data. Server transforms data. Server returns JSON.
When this breaks, debugging is hard. A sequence of text logs is difficult to parse. With AI Diagram Maker, a developer can paste the pseudo-code of the API handler and get a visual flowchart of the request lifecycle. You can clearly see the success paths and the error paths. You can see where the retry logic kicks in. It turns abstract code execution into a concrete map.
Documenting Business Process Automation
Internal tools often run on complex business logic. “When a new lead arrives assign it to sales rep A. If they don’t respond in 24 hours reassign to rep B. Also send a Slack notification to the manager.”
These workflows are often buried in code or Zapier configurations. By visualizing them with an ai flowchart maker, you create a shared understanding. Operations teams and engineering teams can look at the same diagram and agree on how the business actually runs. It exposes inefficiencies like loops that never close or leads that get dropped.
Debugging Decision Trees and Conditional Logic
Sometimes code gets spaghetti-like. You have nested if statements five levels deep. You aren’t sure if a certain condition is ever actually reachable.
You can paste that conditional logic into our tool. The AI unravels the nesting. It lays it out as a decision tree. You might look at the generated diagram and realize “Wait a minute, this branch connects to nothing. That code is dead.” It is a powerful way to audit your own logic.
Manual Flowcharting vs. AI Diagram Maker: A Clear Speed Advantage
Let’s look at the numbers. We are not talking about a marginal improvement here. We are talking about an order of magnitude difference in velocity.
The Traditional Way: Hours of Manual Placement and Alignment
In a traditional tool, creating a moderate complexity flowchart with 20 nodes takes about 45 minutes to an hour.
You spend the first 10 minutes getting the ideas down. You spend the next 20 minutes connecting them and labeling the arrows. You spend the final 15 minutes fixing the alignment because you realized the chart is too wide for the page.
And if you need to change the first step? You might as well start over. The “sunk cost fallacy” kicks in. You stick with a bad design because fixing the diagram is too much work.
The AI Way: Seconds from Text to a Complete Flowchart
With AI Diagram Maker, that same 20-node flowchart takes about two minutes.
You spend 90 seconds writing the prompt to describe the process. You hit enter. The diagram generates in 5 seconds. You spend another 30 seconds reading it to verify the logic.
That is it. You have saved 43 minutes. If you do this once a week, that is nearly 40 hours saved over a year. That is a full work week given back to you to write code or solve problems.
Iteration and Refinement: Effortless Updates Compared to Manual Tools
The speed advantage compounds when you iterate. In software, nothing is right the first time. You refine. You pivot.
In manual tools, iteration is punishment. In AI Diagram Maker, iteration is effortless. You use our chat-based refinement. You say “Make the error path red” or “Remove the second approval step.” The engine handles the heavy lifting. You can experiment with different flows without fear of wasting time on formatting.
Step-by-Step: Creating Your First Flowchart with AI Diagram Maker
If you are ready to stop dragging boxes and start generating value, here is how you get started. It is a simple four step workflow.
Inputting Your Process Description
Start by opening the tool. You will see a text input area. This is your command center.
You don’t need to write perfect code. You can use plain English. Be as specific as you can about the steps and the decisions.
For example, let’s say you are mapping a user registration logic. You might write:
“Start with a user clicking the ‘Sign Up’ button. Show a form asking for email and password. Check if the email contains an ’@’ symbol. If not show an ‘Invalid Email’ error and go back to the form. If yes send the data to the server.”
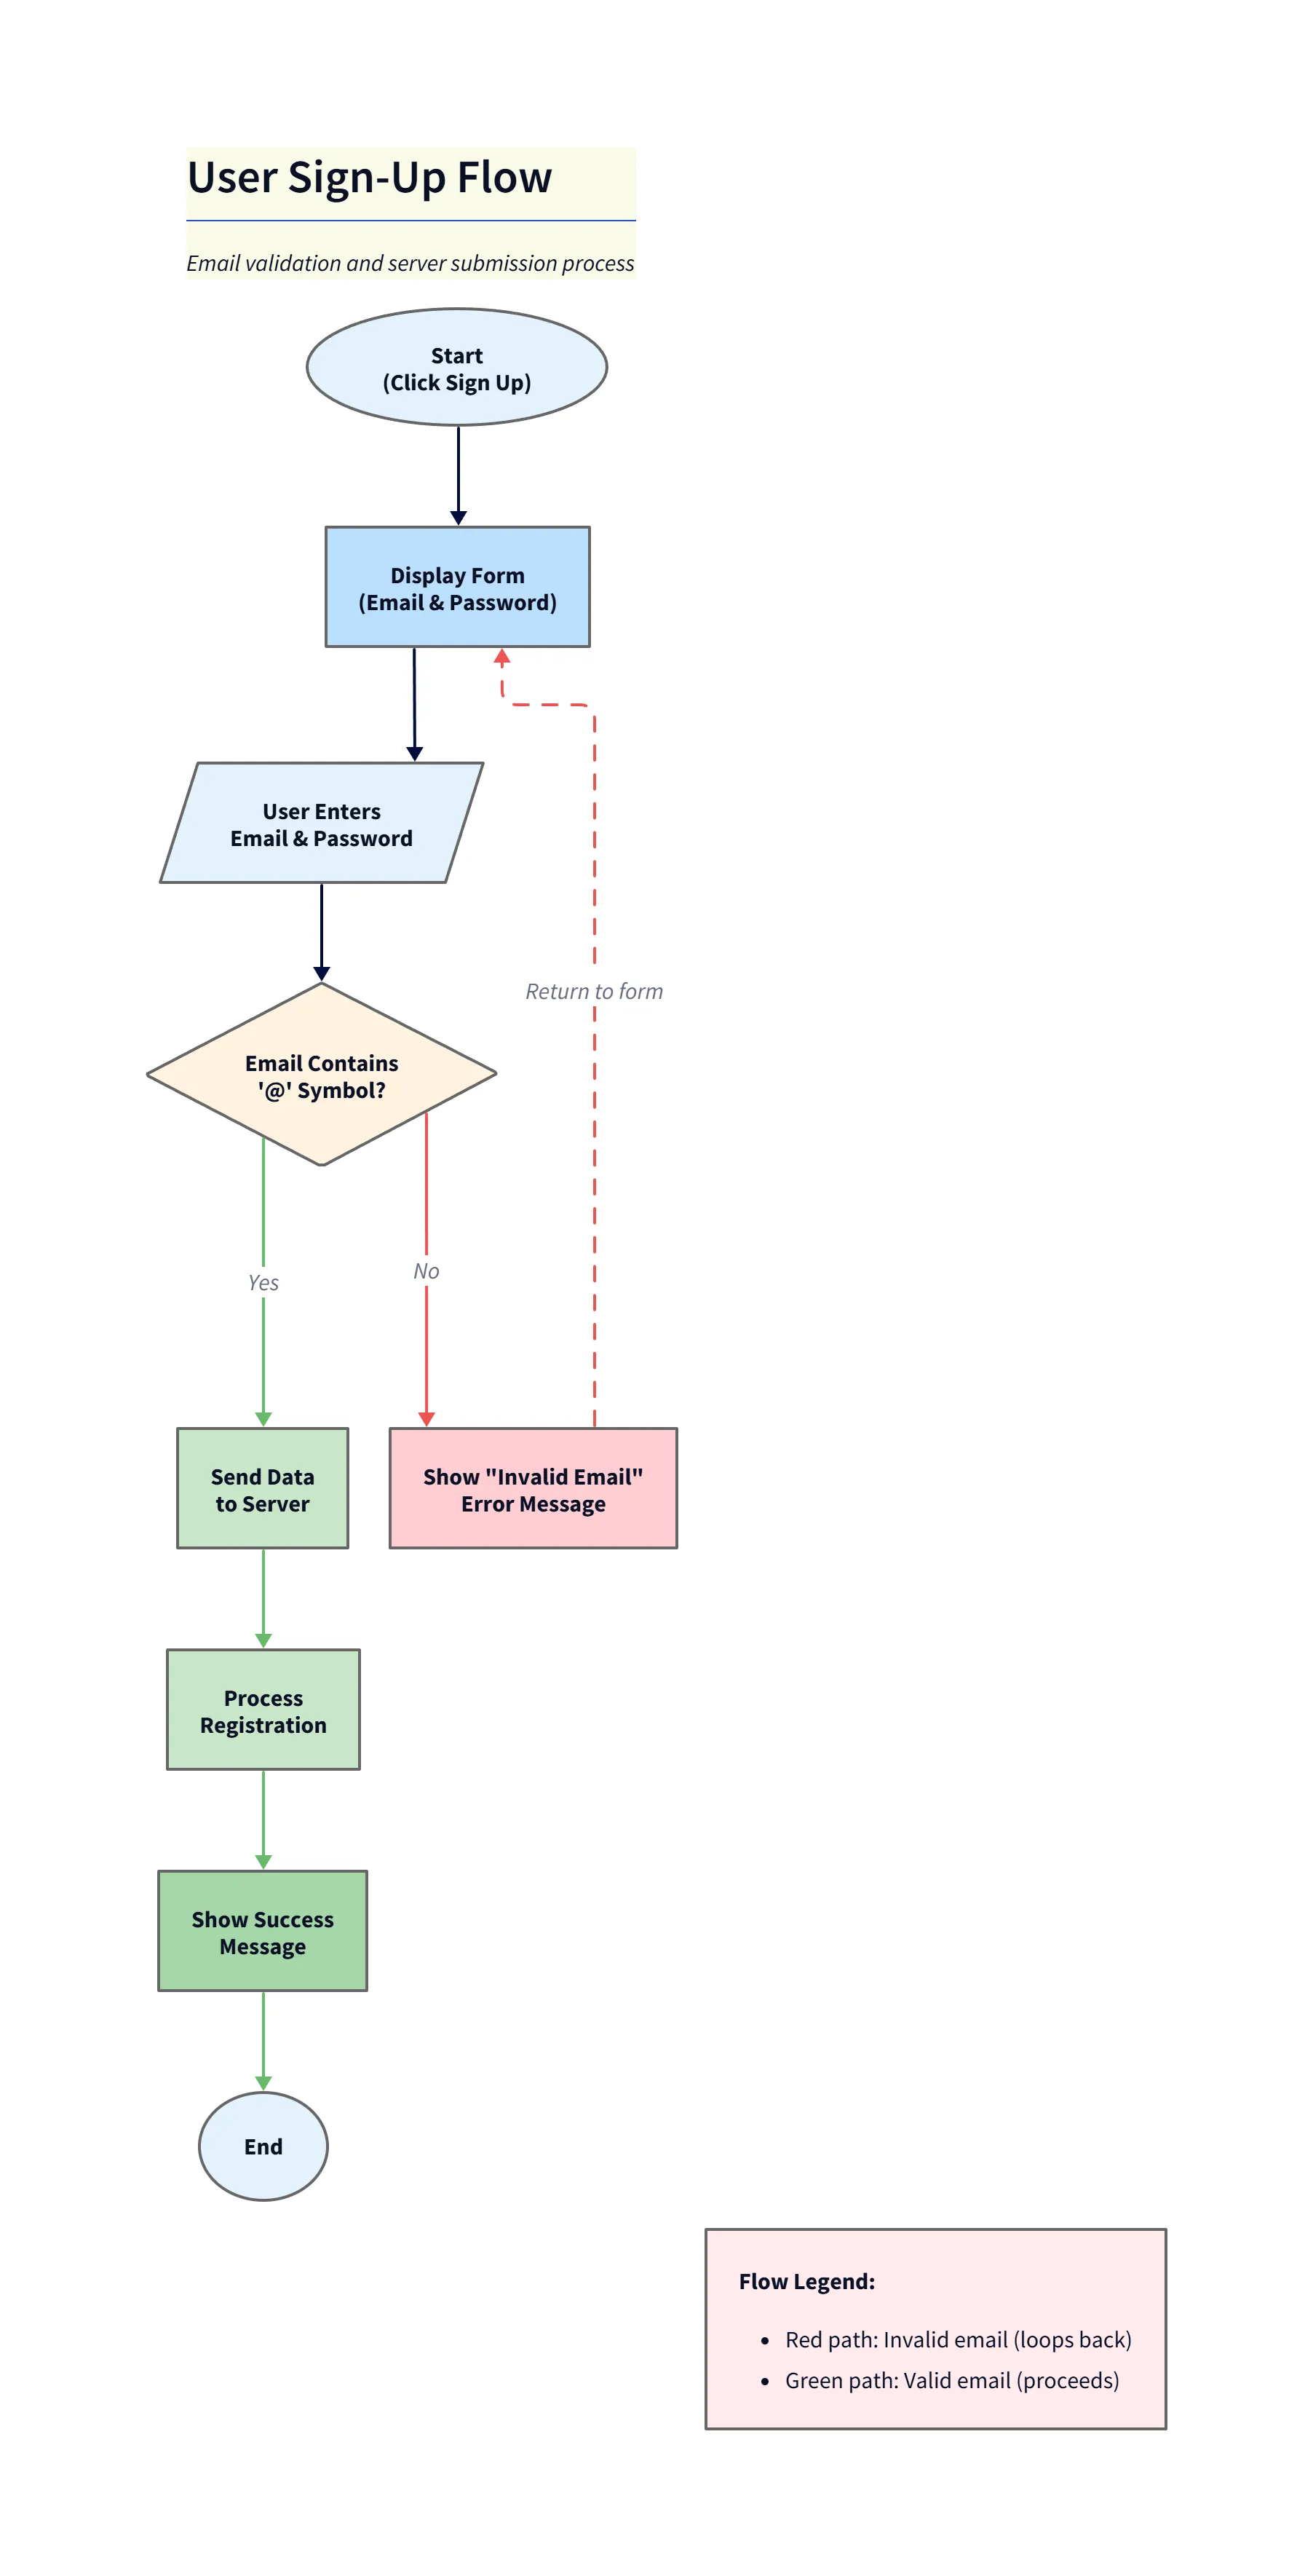
Diagram explanation:
- Start: User clicks the ‘Sign Up’ button which opens the email + password form.
- Client validation: Email is checked for an ’@’ symbol; if invalid show an “Invalid Email” error and return to the form.
- Server submission: If the email looks valid, the client sends the registration data to the server for processing.
You can also use bullet points if that helps you organize your thoughts. The AI is flexible.
Refining and Customizing Your AI-Generated Flowchart
Once the initial diagram generates, take a moment to review it. Does it capture the flow correctly?
Likely you will want to tweak it. This is where our chat interface shines. You don’t click the nodes. You chat with the diagram.
- “Add a decision diamond after sending data to server to check for server timeout.”
- “Label the arrow going back to the form as ‘Retry’.”
- “Change the color of all error states to light red.”
Diagram explanation:
- Server timeout decision: After sending data to the server, a decision checks for a server timeout.
- Retry path (errors): If a timeout occurs, show a “Server Timeout” error (error states are shown in light red) and label the return arrow to the form as Retry.
- Success path: If no timeout, proceed to process the registration and show the success message.
The AI interprets these commands and updates the visual in real time. It keeps your hands on the keyboard and your mind on the flow.
Exporting and Sharing Your Visual Logic
Once you are happy with the flow, it is time to put it to work. You are not creating art for a museum, you are creating documentation for your team.
You can export the diagram as a high-resolution PNG for your presentation slides. Or better yet, you can export it as an SVG to embed directly into your technical documentation.
For the developers out there, you can export the D2 code and manually save the diagram definition directly to your repository. This means your diagrams live right next to your code (with automatic syncing coming soon). Once you commit the file, any colleague who pulls the repo gets the latest diagram definitions instantly. No more hunting through Google Drive for that one lost PNG file.
We also support a seamless copy-paste workflow for tools like VS Code or Cursor. You can generate the diagram in our browser tab, copy the resulting image or code, and paste it right into your markdown files in your IDE.
The Developer’s Guide to AI Diagramming covers more about how this integrates into a broader developer workflow. But for now, the takeaway is simple: If you can describe it, you can diagram it. Stop fighting with the canvas and start flowing.