· Developer Tools · 8 min read
AI System Architecture Generator: High-Level Design (HLD) in Seconds
Stop fighting with icon libraries and crooked lines. Learn how an AI system architecture generator turns your infrastructure vision into professional High-Level Design (HLD) diagrams instantly.
It is Monday morning. You have a meeting with the CTO in thirty minutes. You need to pitch the new microservices migration strategy.
You have the plan in your head. You know we are moving from a monolith on EC2 to serverless functions on Lambda. You know we are splitting the database into three separate RDS instances. You know we need a Redis cache in front of the API.
The plan is solid. But you don’t have a diagram.
You stare at the blank canvas of your diagramming software. You start searching for the “AWS Lambda” icon in the library. You drag it onto the screen. It is too small. You resize it. You search for “Redis.” You draw a line. It is crooked.
Ten minutes pass. You have three boxes on the screen and they look terrible. You feel the sweat starting to form. You are spending your limited prep time fighting with a drawing tool instead of refining your pitch.
This is the reality for almost every Tech Lead and Solution Architect. We are judged on our ability to communicate complex systems but the tools we use to visualize them are manual and slow. We built our ai system architecture generator to end this struggle. We want you to be able to turn your architectural vision into a professional High-Level Design (HLD) instantly.
The Challenge: Designing and Communicating Complex System Architectures
Architecture is about tradeoffs. It is about deciding between consistency and availability. It is about choosing the right tool for the job. But communicating those decisions is just as important as making them. If stakeholders cannot understand your design, they will not approve it.
Why System Architecture Diagrams are Critical for Project Success
A System Architecture Diagram is the shared mental map for the entire project. For the stakeholders, it proves that you have thought through the infrastructure. For the developers, it shows them where their code fits into the bigger picture. For the DevOps team, it is the blueprint for deployment.
Without a clear diagram, everyone has a different idea of what is being built. The frontend team thinks they are talking directly to the DB. The backend team thinks there is a gateway in the middle. This misalignment leads to costly rework later.
The Time-Consuming Process of Manually Drawing HLDs
The problem is that good diagrams take hours to draw. You have to worry about spacing. You have to worry about grouping components into VPCs or subnets. You have to make sure the arrows point the right way to show data flow versus dependency.
This manual effort is a barrier. It makes us hesitant to create diagrams for small changes. It makes us keep using the old outdated diagram because “it is close enough” and we don’t have time to redraw it.
The Difficulty of Rapidly Iterating on Design Concepts for Tech Leads
Architecture is an iterative process. You might start with Option A using a relational database. Then you realize the data is unstructured so you switch to Option B using a NoSQL solution.
In a manual tool, switching from Option A to Option B means deleting half your drawing and starting over. It discourages exploration. You stick with the first draft because editing is too painful.
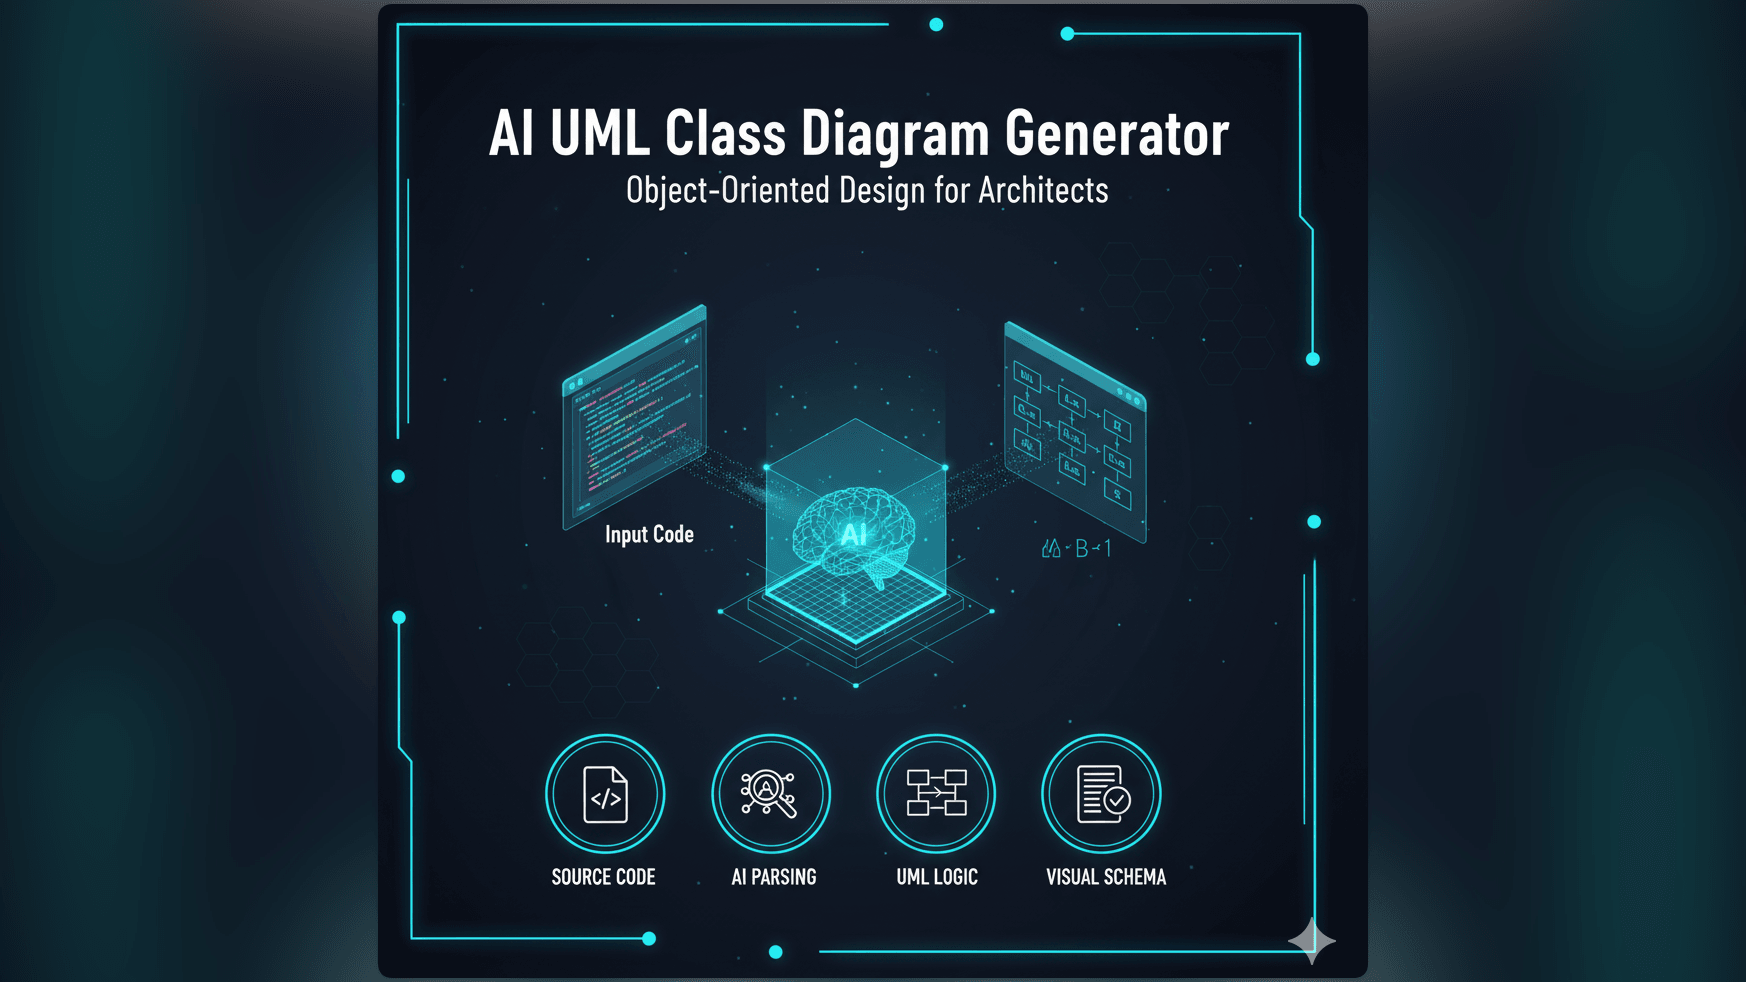
Introducing AI Diagram Maker: Your Smart AI System Architecture Generator
We believe you should be able to design at the speed of thought. You should be able to describe your architecture and see it materialized.
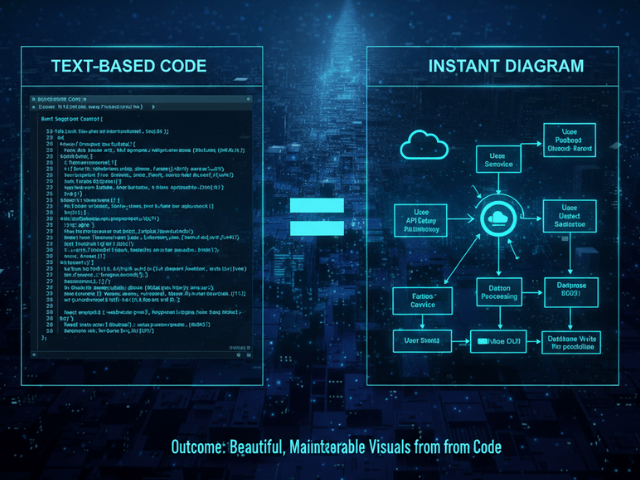
Describe Your System, Get an Architecture: The Power of Text to Architecture Diagram
With AI Diagram Maker, you simply type your stack:
“A scalable web app on AWS. Use a Load Balancer distributing traffic to an Auto Scaling Group of EC2 instances. The database is Aurora PostgreSQL. Use S3 for storing user uploads and CloudFront as a CDN.”
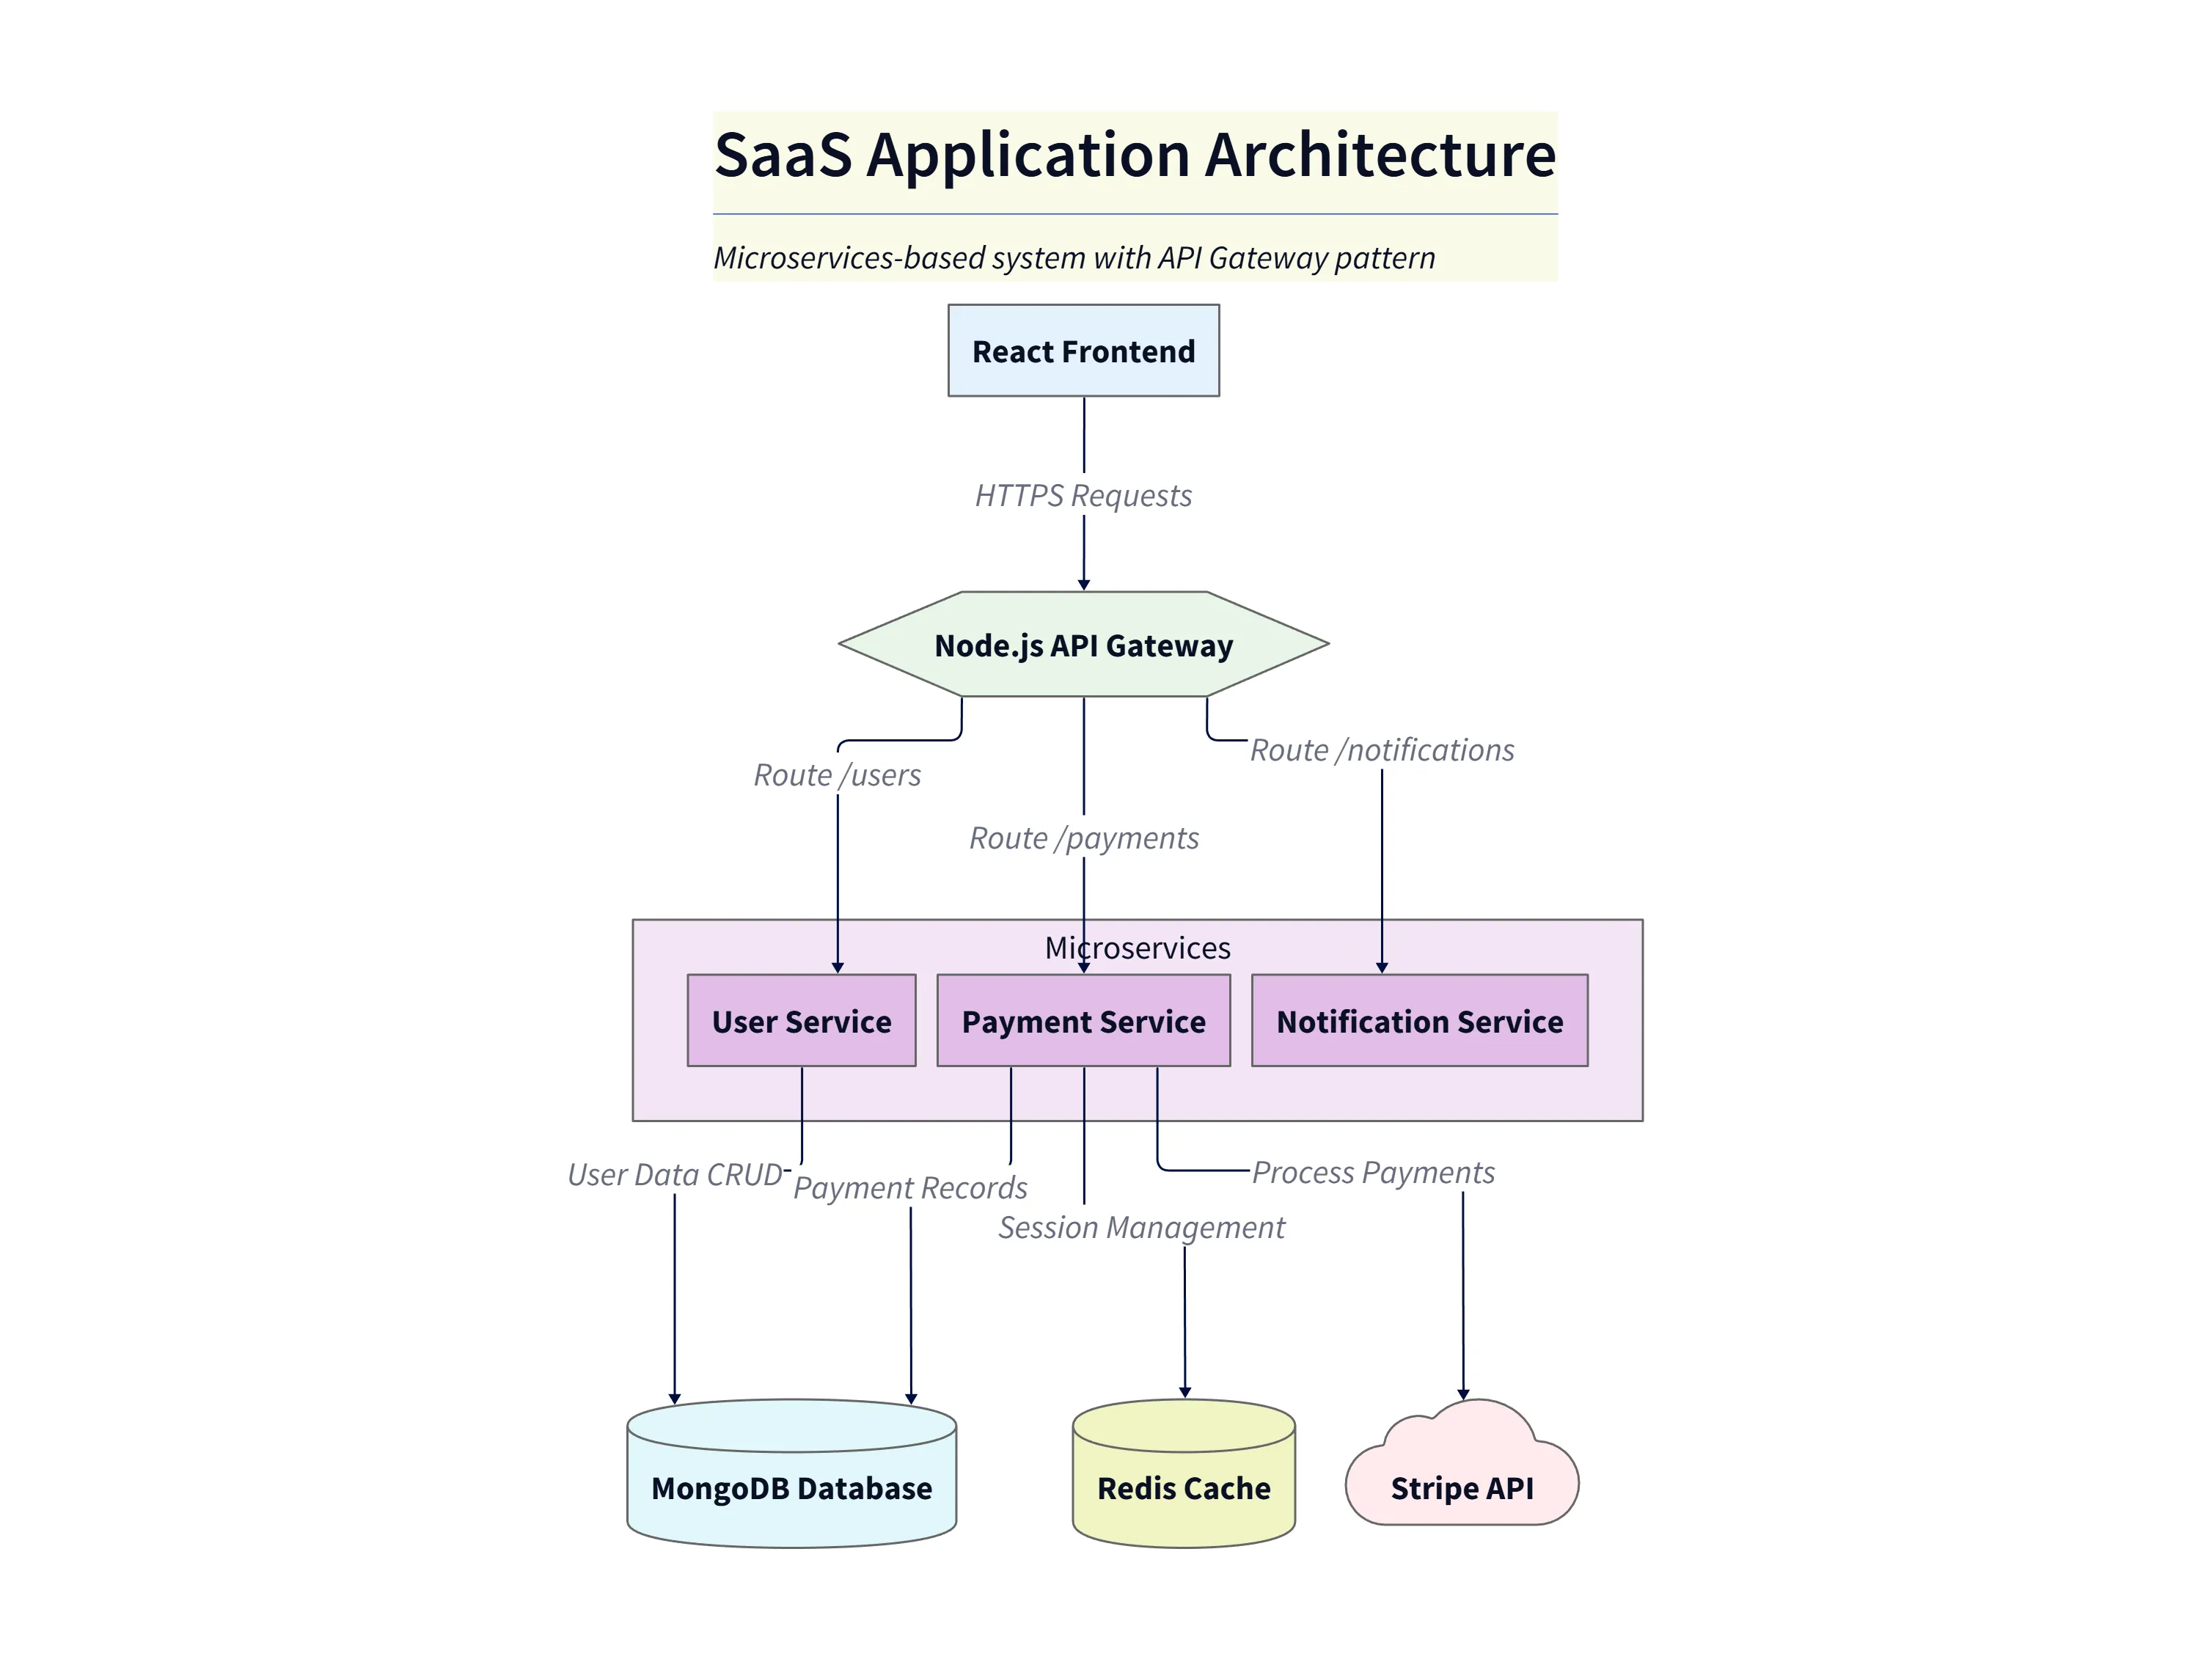
Diagram explanation:
- Edge & CDN:
CloudFrontsits at the edge, serving static assets fromS3and reducing latency for end users. - Traffic distribution: An
Application Load Balancerdistributes incoming requests to an Auto Scaling Group of EC2 instances, ensuring capacity adjusts with demand. - Data stores:
Aurora PostgreSQLhandles relational data whileS3stores user uploads and static assets; arrows indicate request and storage flows. - Outcome: This HLD shows the happy-path data and request flows expected for a scalable, presentation-ready architecture diagram.
Our AI parses this text. It recognizes the specific cloud components. It understands the standard relationships between them. It knows that CloudFront sits in front of S3. It knows that the Load Balancer sits in front of the EC2 instances. It generates a diagram that is technically accurate and visually structured.
How AI Transforms Architectural Concepts into Visuals
Our engine isn’t just matching keywords to icons. It understands hierarchy and flow. It groups the backend components together. It places the external services on the periphery. It draws the connections to show the flow of requests.
It handles the layout logic that usually consumes so much of your time. It ensures that the diagram is balanced and readable.
Key Advantage: Rapid Generation of High-Level Design (HLD) for Presentations
The result is a presentation-ready image. You can copy it directly into your Google Slides or PowerPoint. You can walk into that meeting with the CTO confident that your visual aids look professional. You spent thirty seconds generating the diagram, which left you twenty-nine minutes to prepare your actual talking points.
Essential Use Cases for AI-Generated System Architecture Diagrams
This tool is a force multiplier for anyone in a technical leadership role.
Presenting New System Designs to Stakeholders
When you are pitching a new project, you need to sell the vision. A clean professional architecture diagram builds confidence. Using AI, you can generate three different variations of the architecture to show options. “Here is the ‘Low Cost’ option and here is the ‘High Availability’ option.” You can generate both in minutes and compare them side-by-side.
Documenting Existing Infrastructure for Onboarding
New hires often struggle to understand the “Big Picture.” You can generate a system overview diagram to include in your onboarding wiki. “Here is how our system fits together.” It gives them context and helps them ramp up faster.
Comparing Different Architectural Approaches Rapidly
Should we use Kafka or RabbitMQ? Should we use Lambda or Fargate? You can generate diagrams for both scenarios. Seeing the complexity difference visually often helps in making the decision. “Wow the Kafka setup introduces three extra moving parts. Maybe we stick to simple queues for now.”
Visualizing Microservice Deployments and Interactions
If you have a complex microservice mesh, describing it in text is impossible. You need to see the topology. You can describe the services and their dependencies and the AI will layout the graph. You can see the clusters of chatty services and identify single points of failure.
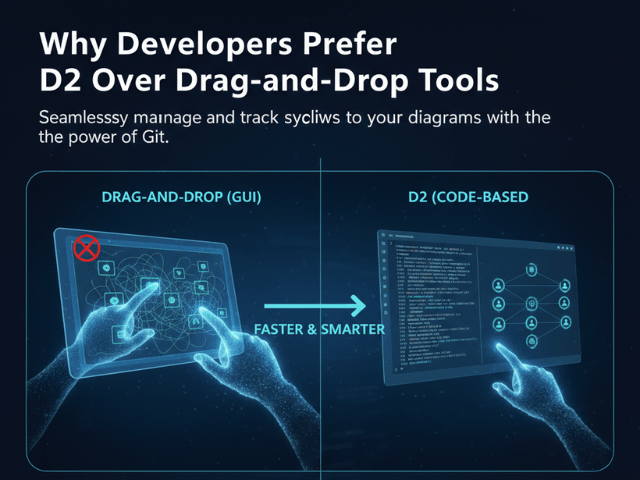
Manual HLD Creation vs. AI Diagram Maker: A Game Changer for Tech Leads
The Traditional Way: Hours Spent on Layout, Iconography, and Connections
- Search for icon sets.
- Download and import into tool.
- Drag server icons and duplicate.
- Draw boxes for subnets and VPCs.
- Resize everything when a box is too small.
- Draw and style lines.
It is a design project: not an engineering project.
The AI Way: Instant Visualization from a Text Description
Type: “Three web servers in a private subnet connected to a public load balancer.” Click Generate.
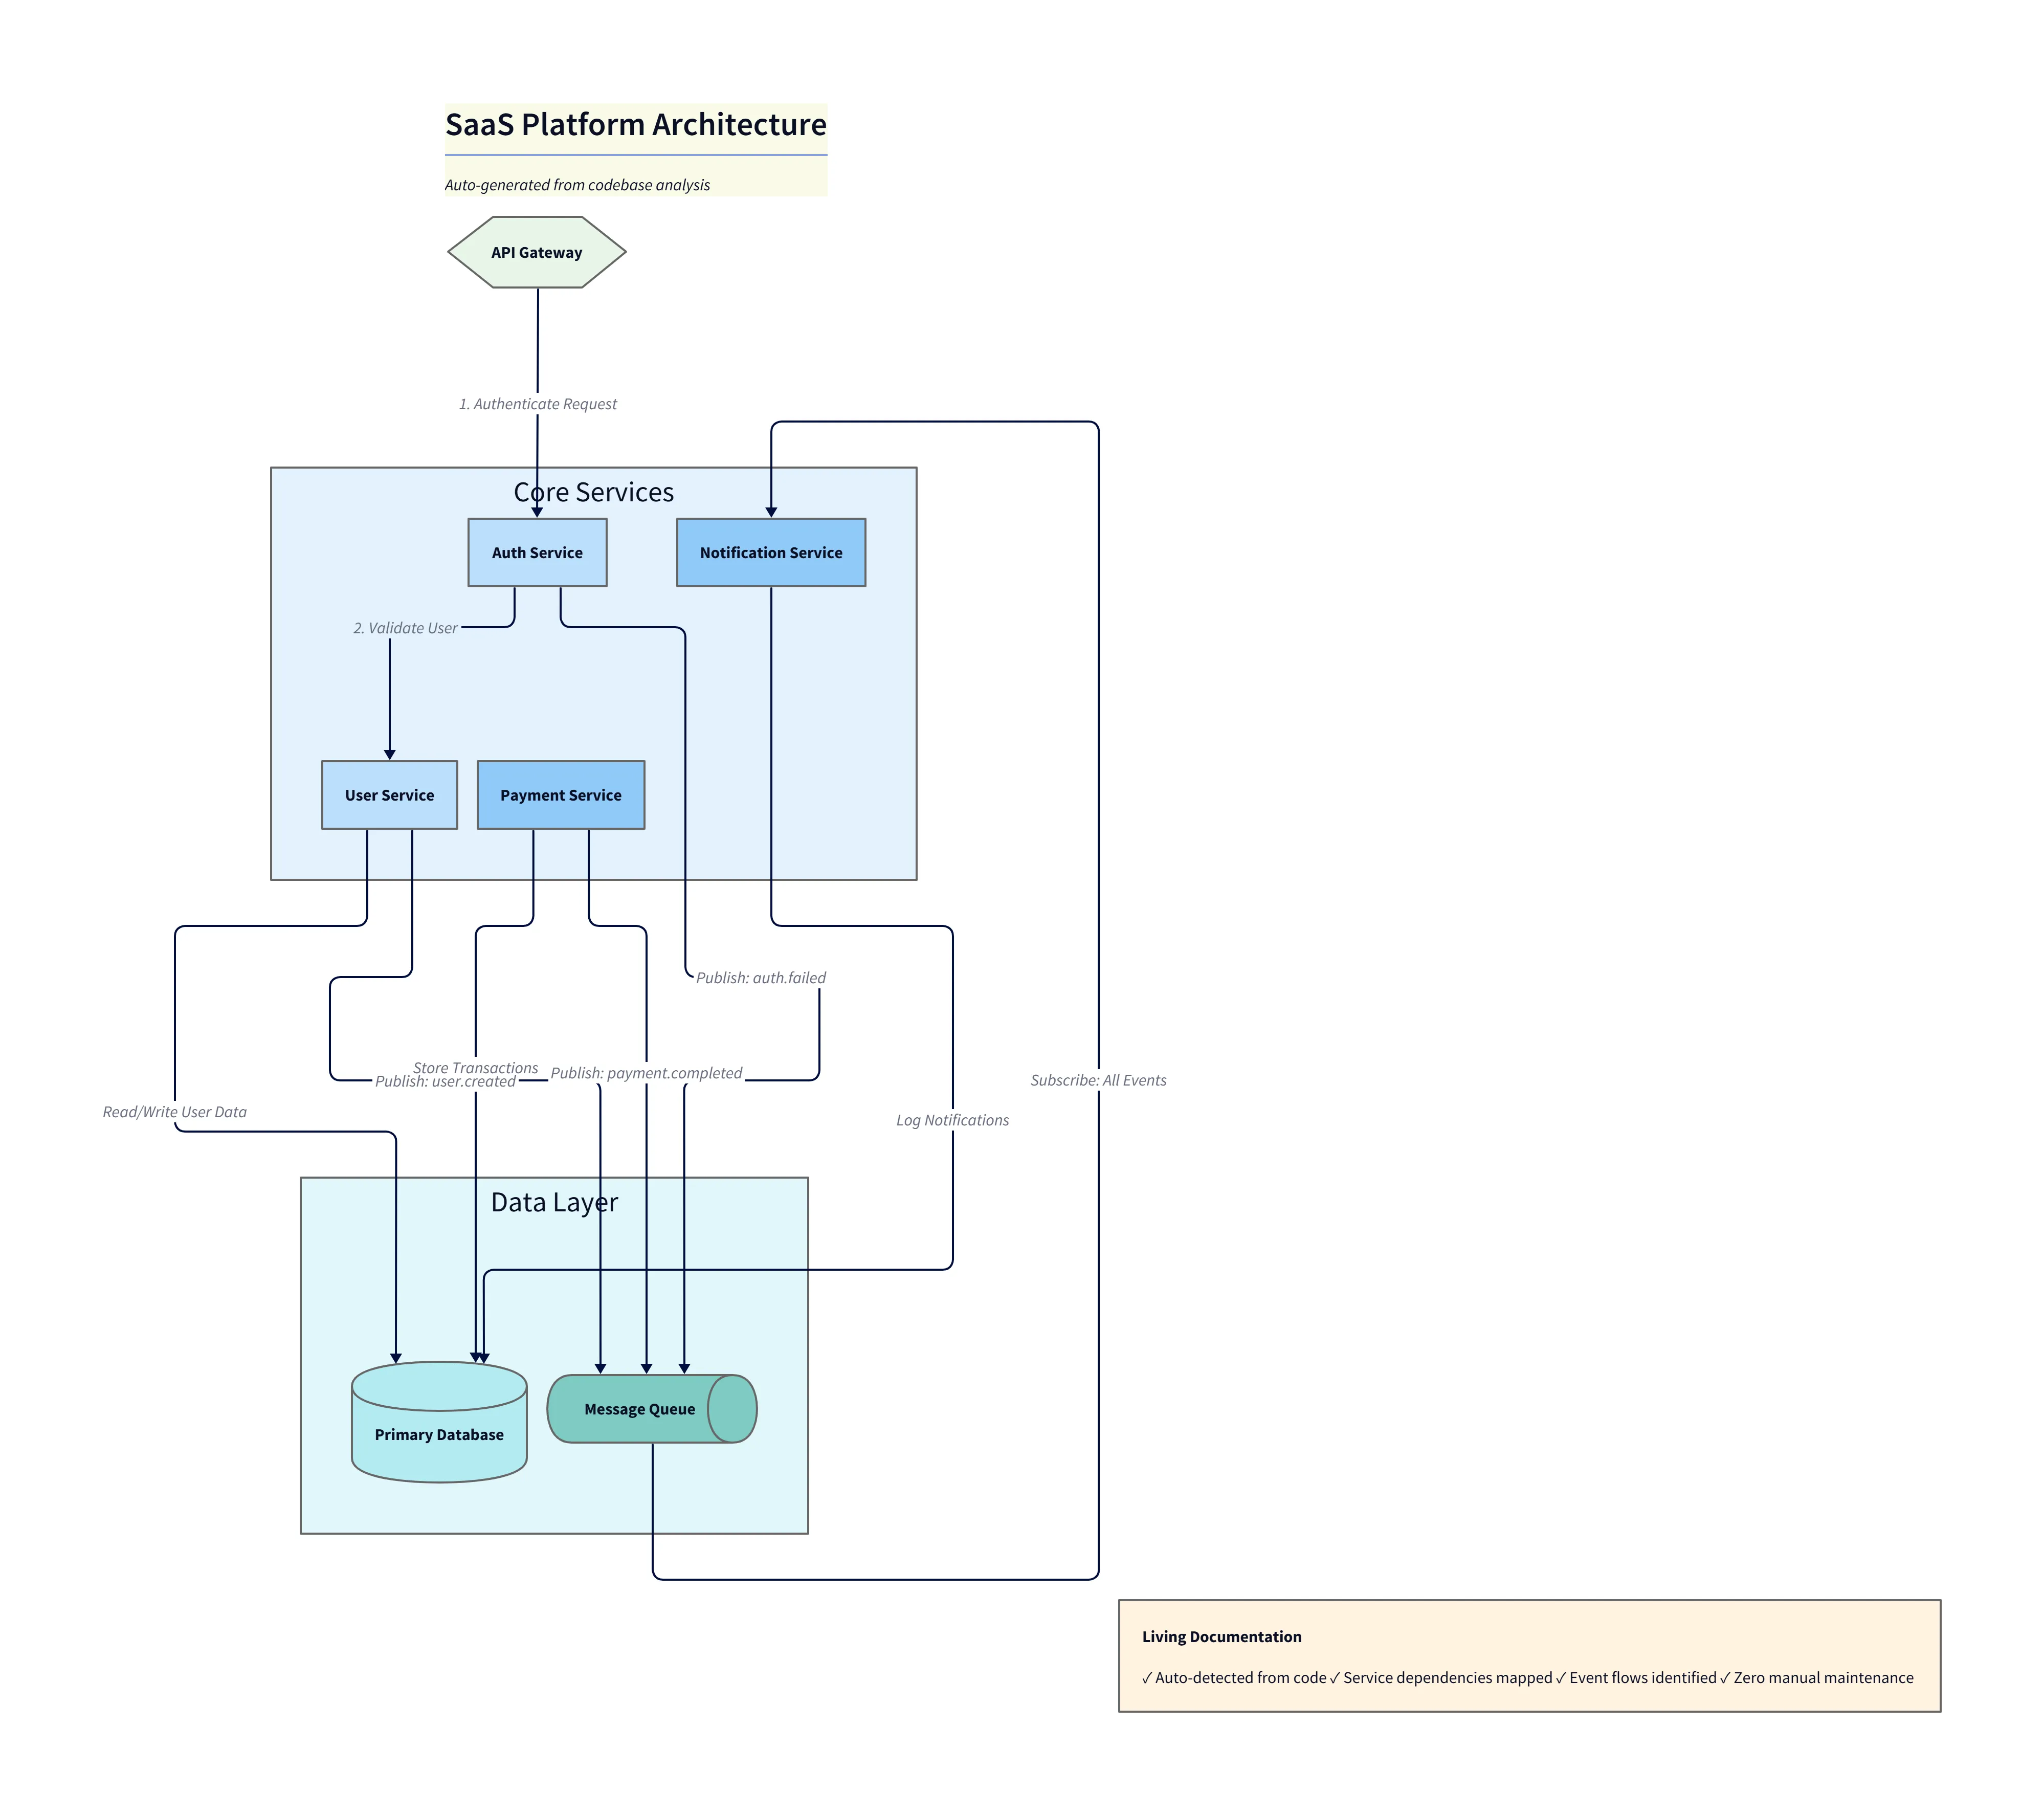
Diagram explanation:
- Network segregation: Shows a
Public Subnetcontaining theLoad Balancerand aPrivate Subnetcontaining the three web servers, illustrating least-privilege exposure. - Flow of requests: External traffic reaches the load balancer in the public subnet which forwards requests to web servers in the private subnet.
- Backend connectivity: Web servers in the private subnet connect to downstream resources (database and S3) for queries and uploads; arrows make these dependencies explicit for ops and security reviews.
- Presentation use: This variant emphasizes VPC/subnet boundaries for architecture discussions and security-focused reviews.
The AI handles the nesting and alignment. (Note: Specific cloud provider icons are coming soon; currently, we use standard shape representations).
Effortless Iteration: Quickly Adjusting Design Elements with Simple Prompts
If the CTO says “We can’t use AWS, we need to be cloud agnostic,” you don’t have to redraw everything. You just tell the chat: “Replace AWS components with generic Kubernetes components.” The AI updates the labels and components while preserving the structure.
Step-by-Step: Creating Your High-Level Design with AI Diagram Maker
- Defining System Components in Natural Language: Write a paragraph describing your system. Be explicit: “Users upload videos to an API Gateway. The gateway triggers a processing Lambda. The Lambda saves metadata to DynamoDB and the video file to S3.”
- Leveraging AI for Initial Architecture Diagram Generation: Hit generate. The AI builds the visual model, correctly capturing the flow of data based on your description.
- Refining and Adding Details to Your HLD: Use the chat to tweak it: “Group the Transcoding Service in a box labeled ‘3rd Party Vendor’” or “Add a WAF in front of the API Gateway.”
- Exporting for Presentations and Collaboration: Export as a high-resolution format. Because we support Infrastructure as Code (IaC) principles conceptually, you can save the text description in your repo for version control.
The Developer’s Guide to AI Diagramming puts the focus back where it belongs: on the architecture, not the artwork.