· Developer Tools · 8 min read
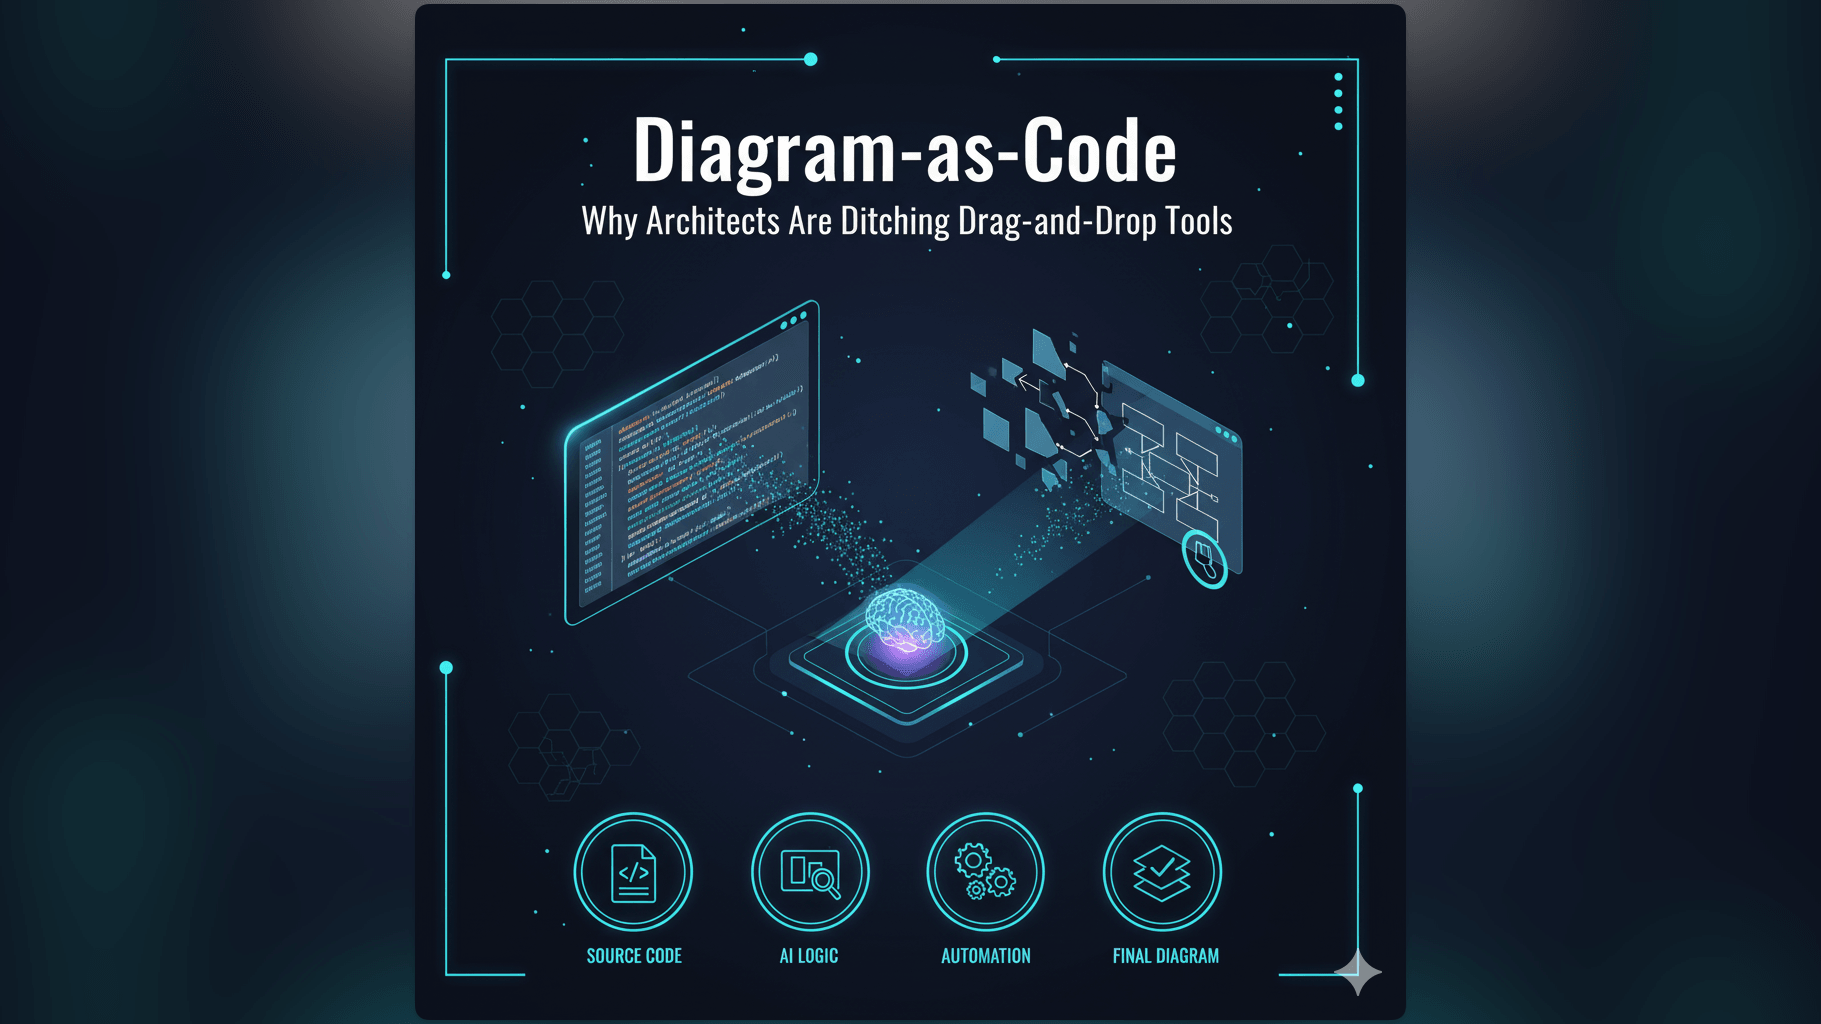
Diagram-as-Code: Why Architects Are Ditching Drag-and-Drop Tools
Traditional diagramming is disconnected from reality. Learn why software architects are moving toward diagram-as-code tools to create versionable, maintainable, and automated technical visuals.
I want you to open your company’s internal wiki or Confluence page. Find the “System Architecture” page. Look at the diagram there. Now look at the “Last Updated” timestamp.
I am willing to bet it is at least six months old. In software time, that is ancient history. The diagram probably shows a monolithic database that you migrated away from last quarter. It shows three microservices that have since been merged into one.
This is the fundamental problem with traditional diagramming: it is disconnected from reality. For decades we have treated diagramming like an art project. We use tools that act like digital canvases. We drag boxes. We nudge pixels. We pick colors. We treat the diagram as a static image that exists outside of our development workflow.
But software architects and senior engineers are realizing that this approach is broken. We treat infrastructure as code. We treat configuration as code. We treat policy as code. It is time we treated diagrams as code.
This guide explores the movement toward diagram-as-code tools and why moving from “drawing” to “coding” your visuals is the only way to keep documentation alive.
The Evolution of Documentation: From Manual Drawing to Code-Driven Diagrams
In the early days of software engineering, we drew on whiteboards and took pictures. Then came tools like Visio. Then came the web-based era of Miro and Lucidchart. These tools are fantastic for brainstorming. They offer infinite freedom. You can draw a unicorn next to a database if you want.
The Limitations of Traditional Drag-and-Drop Tools
But for technical documentation, that freedom is a trap. When you use a drag-and-drop tool, you are manually maintaining the visual state. If you need to align ten boxes, you have to select them all and click “Align Top.” If you need to change the style, you have to click every single element.
More importantly, these tools produce binary blobs or proprietary file formats. You cannot “diff” a PNG file. You cannot merge a .drawio file easily in Git. If two developers update the architecture diagram at the same time, one of them is going to overwrite the other’s work.
Why Developers and Architects Seek More Than Just Visuals
Developers hate context switching. We live in the terminal and the IDE. Asking us to open a separate browser tab, login to a third-party design tool, and fiddle with a GUI is a huge request.
We want tools that fit into our existing mental models. We want to be able to grep our documentation. We want to be able to generate it automatically. We want the source of truth to be text, not pixels.
The Vision: Diagrams That Live Alongside Your Code
The vision of the Diagram-as-Code movement is simple: the diagram source should be a text file. That text file should live in the same repository as the code it describes. When the code changes, the diagram file changes in the same commit.
What Exactly is Diagram-as-Code? A Developer’s Perspective
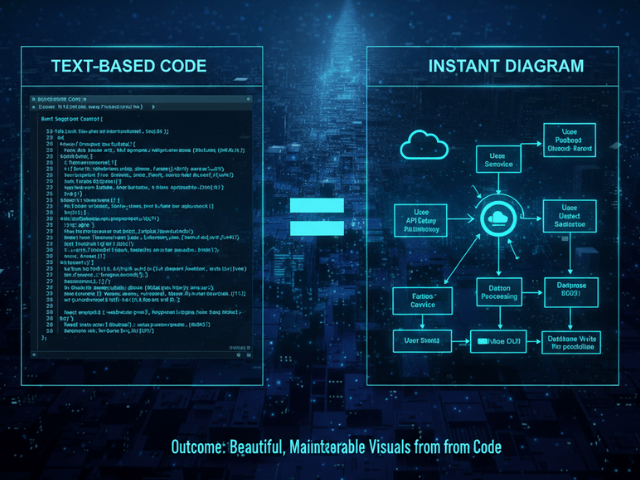
At its core, Diagram-as-Code is the practice of defining diagrams using text. You write a script or a definition file and a renderer compiles that text into an image.
Defining the Core Principles: Text-Based, Versionable, Automatable
There are three pillars to this philosophy.
- Text-Based: You don’t store the image. You store the recipe for the image. This means the file size is tiny and it is readable by humans even without the rendering tool.
- Versionable: Because it is text, you can track every single change in Git. You can look at the git blame (or praise) to see who added that new load balancer to the diagram.
- Automatable: You can run a script in your CI/CD pipeline to regenerate all the PNGs from the text files every time you deploy. This ensures the visuals in your README are always in sync with the definition files.
Why Mermaid JS Alternative and Eraser IO Alternative are Gaining Traction
Tools like Mermaid.js pioneered this space. They created a markdown-like syntax for charts. You write A -> B and it draws an arrow.
This was a massive leap forward. But it introduced a new problem: you have to learn the syntax. You have to remember if a decision diamond is defined by curly braces {} or brackets []. You spend half your time looking up the documentation to remember how to change the arrow color. This is where the next generation of tools comes in.
Introducing AI Diagram Maker: The Next Generation of Diagram-as-Code Tools
We built AI Diagram Maker to be the ultimate Diagram-as-Code tool because we removed the hardest part, which is the syntax.
Text-First Approach: Describe Your Diagram, Let AI Draw It
We stick to the core philosophy. You provide text; we provide a diagram. But instead of forcing you to learn a rigid markup language, we let you use natural language or existing code. You can write “User login flow with error handling” and we generate the structure. You get the benefits of text-based definition without the learning curve of a new language.
Beyond Simple Syntax: Leveraging AI for Intelligent Generation
Traditional Diagram-as-Code tools are dumb renderers. If you make a typo, they crash. Our AI is an intelligent interpreter. If you paste a SQL schema that has a syntax error, we can often figure out what you meant and still generate the ER Diagram. If you describe a system architecture but forget to mention the firewall, we might suggest it or handle the connection logic gracefully.
The AI Diagram Maker Advantage: Combining Ease of Use with Code Principles
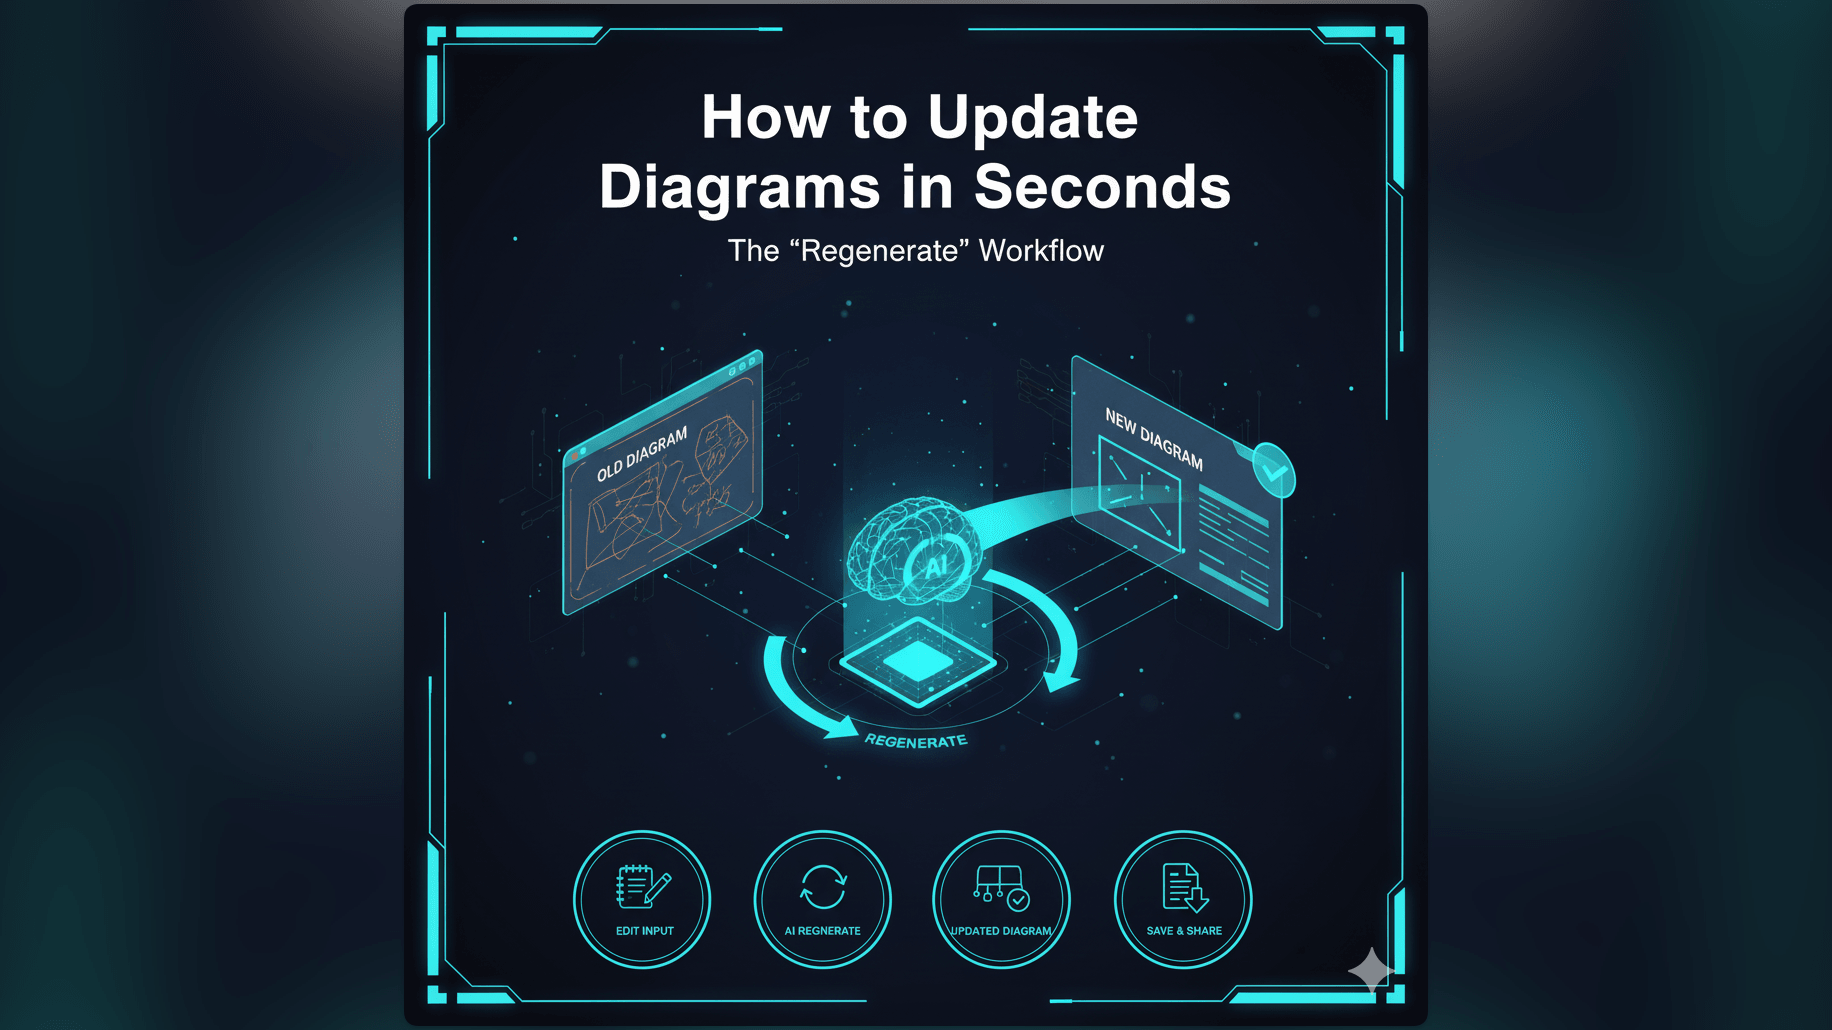
We allow you to edit the diagram using a chat interface. This effectively modifies the underlying definition without you needing to know the specific commands. It is “Low-Code” Diagram-as-Code.
The Power of Version Control and Git Integration for Diagrams
This is the killer feature for any serious engineering team. If it is not in Git, it does not exist.
Tracking Changes to Diagrams Just Like Code
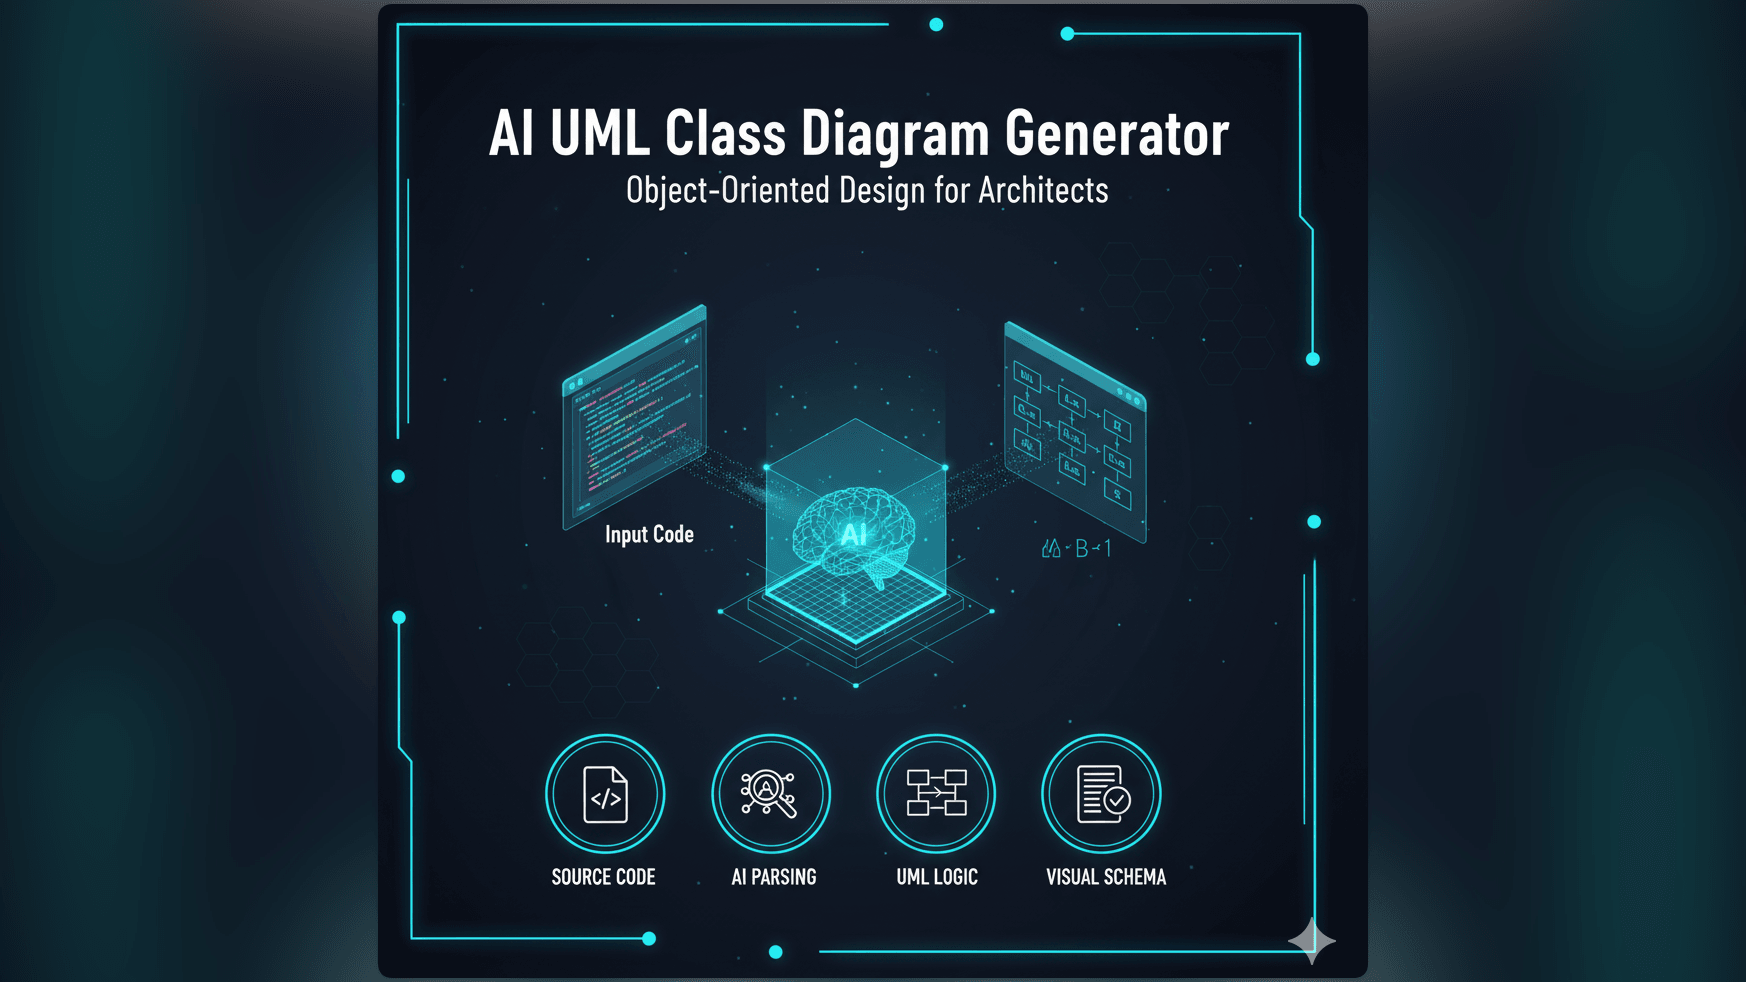
You can manually save your diagram definitions (D2 files) directly to your repository, with native automated integration coming soon. Imagine you are refactoring a legacy class structure. You update the Java code. In the same Pull Request, you open the AI Diagram Maker file and update the text description or paste the new code snippet to regenerate the UML Class Diagram.
When your Tech Lead reviews the PR, they see the code changes and the diagram changes in the same view. They can verify that the visual documentation matches the code implementation immediately.
Collaborative Diagramming with Pull Requests and Merges
This solves the collaboration nightmare. In traditional tools, locking is an issue. “Hey are you editing the architecture board? I can’t save.”
With Diagram-as-Code, collaboration follows the standard Git workflow. Two developers can work on different parts of the diagram definition on different branches. When they merge, Git handles the text merge. If there is a conflict, you resolve it just like a code conflict.
Ensuring Diagrams Are Always in Sync with Your System’s State
Because the diagram is tied to the commit hash, you can always go back in time. You can checkout a version of the code from last year and the diagrams in that repo will reflect the architecture as it was then. This historical accuracy is impossible with a shared Google Drive folder of PNGs.
Practical Applications of Diagram-as-Code with AI
Maintaining Up-to-Date System Architecture Documentation
For High-Level Designs (HLD), you can keep a file in your repo called architecture.ai. When you add a new microservice, you add a line to this file. The diagram updates. Your onboarding documentation never rots.
Automating Diagram Generation in CI/CD Pipelines
While we treat diagrams as dynamic, you often need static assets for reports or wikis. Because the source is text, you can automate the export process. Your build pipeline can take the definition files and generate fresh SVG or PNG assets.
Facilitating Code Reviews with Integrated Visuals
A picture is worth a thousand lines of diff. Including a generated diagram in your PR description helps reviewers understand the intent of your changes before they dive into the syntax.
Creating Reproducible and Consistent Design Artifacts
Manual tools lead to inconsistency. One developer likes blue boxes; another likes rounded corners. Diagram-as-Code enforces consistency. The rendering engine decides the colors and spacing based on a global theme, ensuring every diagram looks uniform and professional.
Transitioning to Diagram-as-Code with AI Diagram Maker
Moving from a visual tool to a text-based tool can feel daunting at first, but the transition is easier than you think.
Getting Started: Your First Text-Based Diagram
Start small. The next time you need to explain a logic flow, do not open Miro. Open AI Diagram Maker. Type out the logic: “Process A calls Process B. If error retry.” See the result. You will realize that typing is faster than drawing and that you don’t have to worry about alignment.
Integrating into Your Existing Development Workflow
Once you are comfortable, connect your GitHub repository. Start storing your diagrams next to your code. Establish a team rule: “No PRs without updated diagrams.” Because updating the diagram is now as easy as updating a text file or generating a fresh visual, the team will actually follow this rule.
Overcoming Common Challenges of Adoption
The biggest challenge is letting go of pixel-perfect control. You have to accept that for technical documentation, clarity and accuracy are more important than artistic expression. The trade-off is well worth it for the speed and maintainability you gain.
This guide goes deeper into the specific diagram types, but the philosophy remains the same. Stop treating diagrams like pictures. Start treating them like code. Your future self will thank you when you can git checkout your documentation.