· Tutorial · 10 min read
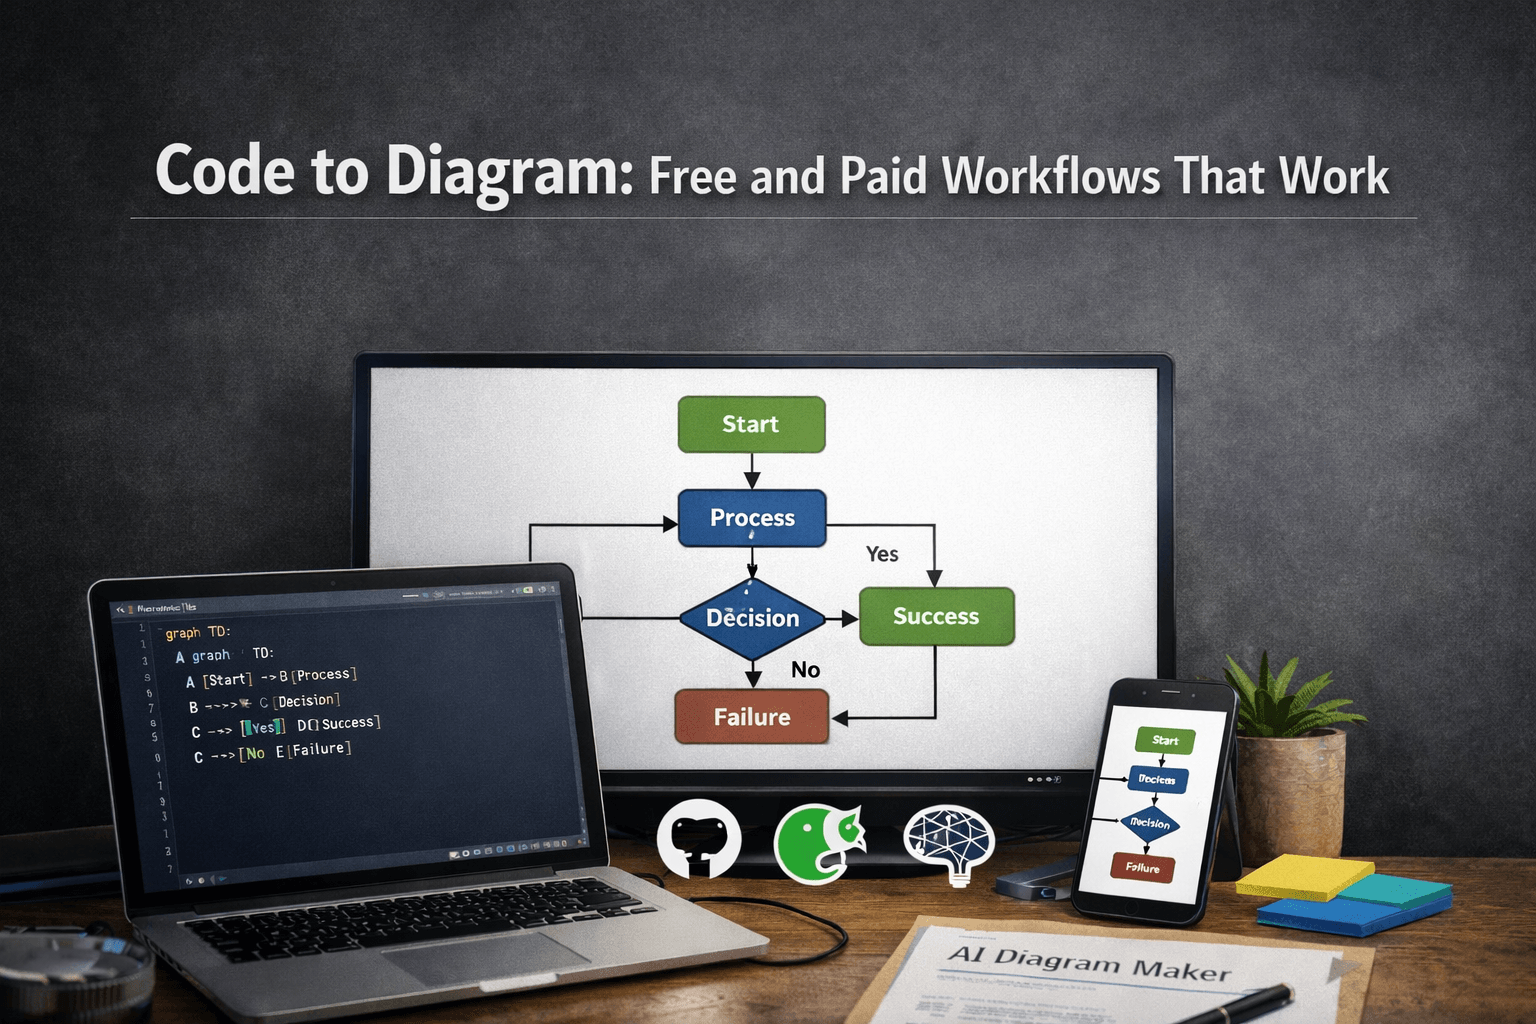
Code to Diagram: Free and Paid Workflows That Work
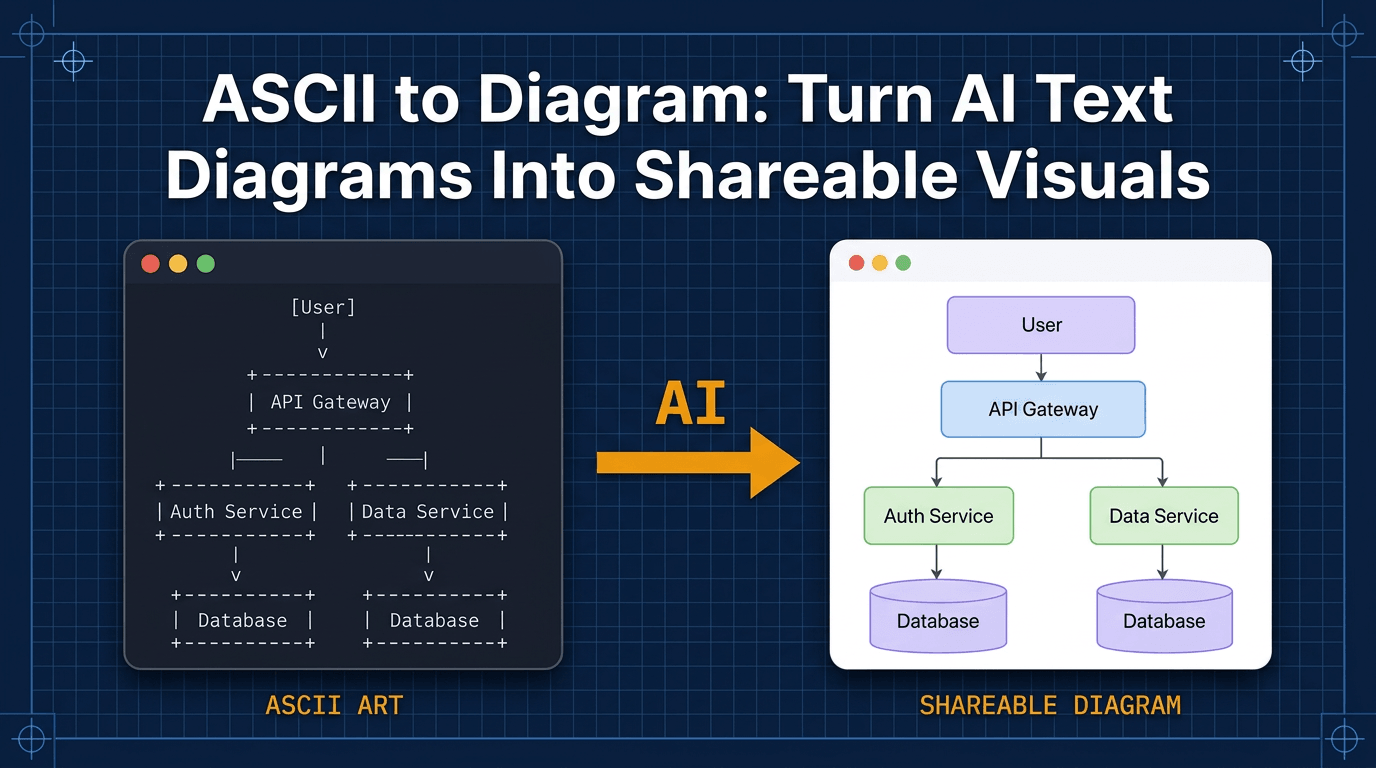
Learn how to turn code into diagrams from GitHub or Cursor using GitDiagram, MermaidJS, and AI Diagram Maker in fast, practical workflows.
Code to diagram sounds simple when you say it out loud. In practice, it usually means one of two things: you have a repository link and want a fast overview, or you already have the code open in your editor and want a diagram without breaking your flow.
That is the angle I want to focus on in this guide. Instead of reviewing every tool on the market, I will show two practical workflows I would actually use: one from a GitHub repository link, and one from code opened directly in Cursor. Each workflow has a free option and a paid option, so you can pick the one that matches the job.
If you want a deeper repo-first walkthrough after this, I already wrote a guide on how to generate diagrams from GitHub repositories using AI. If your workflow is editor-first, the companion guide on diagram generator MCP in Cursor, Claude Code, and VS Code goes further into the MCP side.
What code to diagram means in practice
When developers say they want to create a diagram from code, they usually want one of three outcomes:
- a quick architecture overview of an unfamiliar repo
- a class or relationship view of a codebase they are already reading
- a shareable diagram for docs, onboarding, or a design review
The input matters more than people expect. If the repo is on GitHub and you just need orientation, a link-based workflow is usually enough. If you are already inside Cursor, editor-based workflows feel much better because you can stay close to the code and prompt for a specific diagram type.
I like to think of it this way: GitHub workflows are better for quick discovery, while Cursor workflows are better for focused analysis.
Method 1: Create diagrams from a GitHub repo
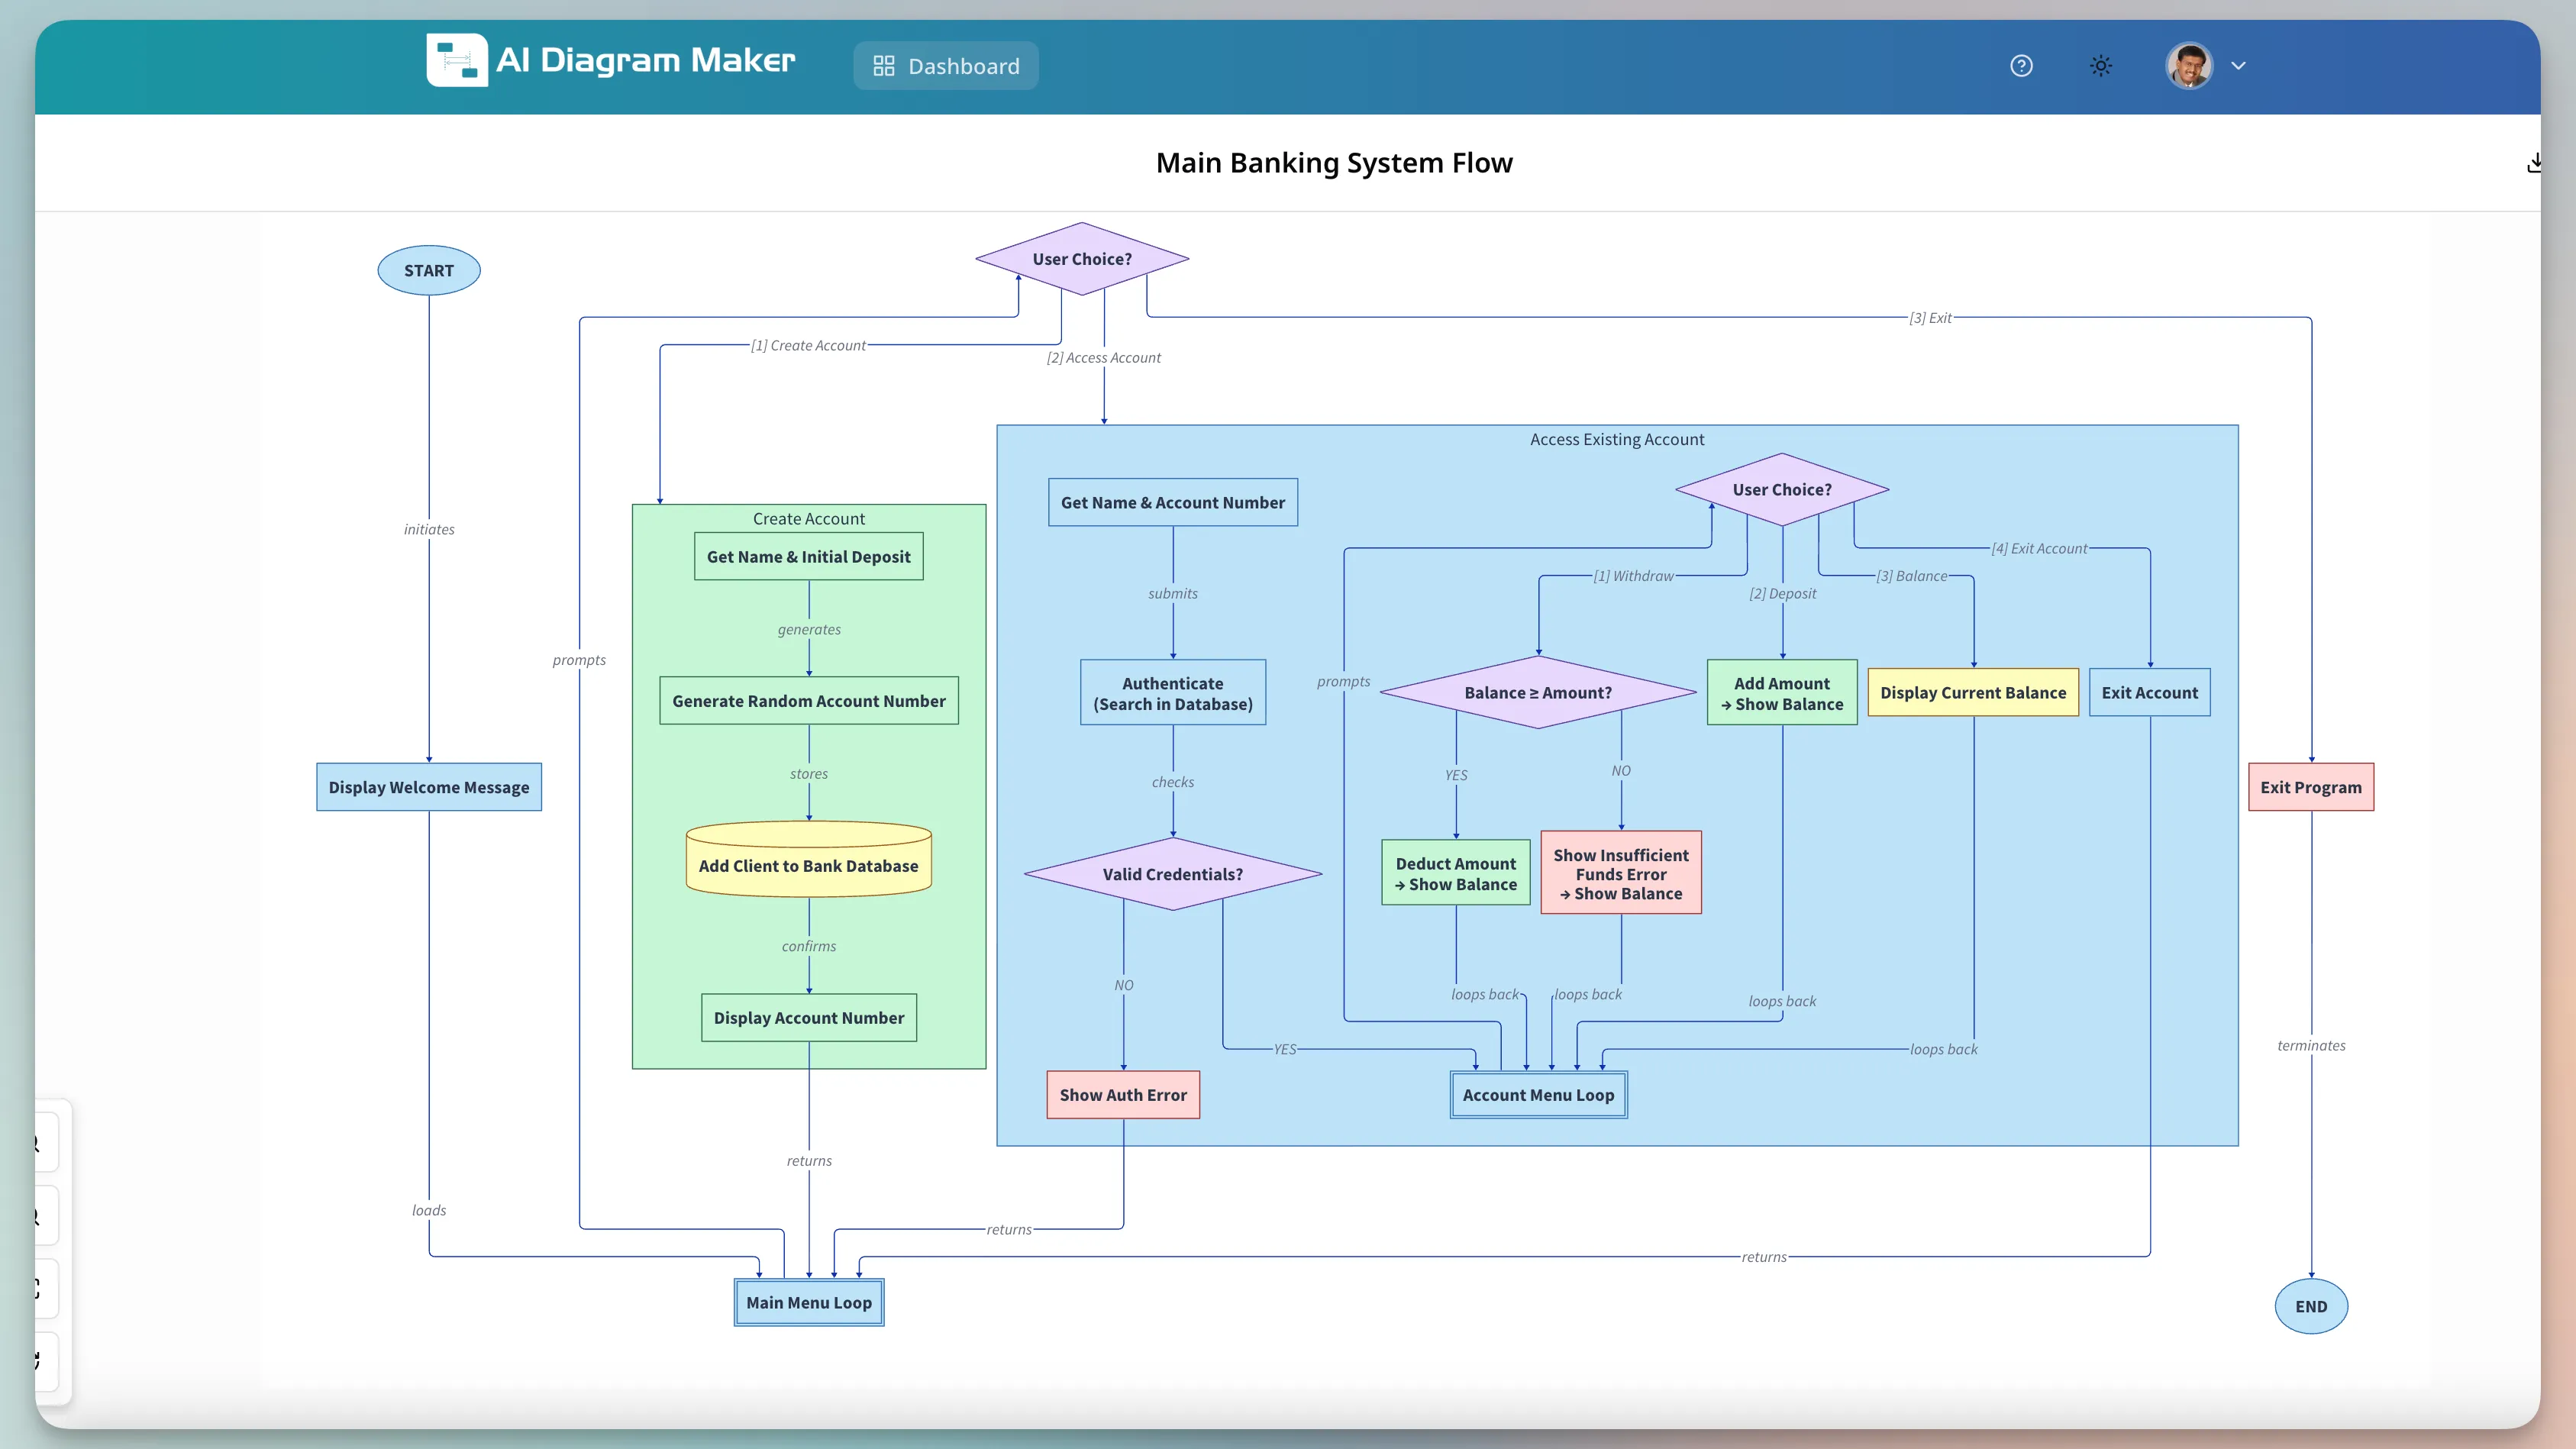
For the GitHub-based example, I am using Simple Banking System, which the repository describes as a simple banking system program built with Python and OOP. It is a good starter example because the domain is easy to understand, and the object-oriented structure makes it a reasonable fit for diagram generation.
Free option: GitDiagram
GitDiagram is the fastest route when you want a quick visual without setting up anything. Its whole value is speed: you give it a public GitHub repository, and it turns that repo into an interactive diagram for exploration.
There are two easy ways to use it:
- Open GitDiagram and paste the repository URL.
- Or take the GitHub repo URL and switch to the GitDiagram version directly.
For this banking example, the workflow is basically:
- Open the GitHub repo.
- Send that repo to GitDiagram.
- Let it generate the repo visualization.
- Click around to understand the structure before you read code in detail.
That is where GitDiagram works well. It helps you get your bearings fast. If I am about to explore a new codebase and want a lightweight map first, this is the kind of tool I reach for.
There are a couple of trade-offs worth knowing upfront. GitDiagram only works with public repositories, so if your codebase is private it is not an option. The output is also an interactive visualization, not an editable diagram — you can explore it, but you cannot customize the layout, rename nodes, or export a version you have tweaked. And crucially, there is no way to customize the prompt. You cannot tell GitDiagram to focus on a specific module, change the diagram type, or filter out parts you do not care about. You get a single fixed view of the repository. For personal understanding that is often fine, but for a design review or a doc I plan to share with other people, I usually want something I can actually edit and direct.
Paid option: AI Diagram Maker code-to-diagram
The paid workflow is to use AI Diagram Maker’s code-to-diagram flow with the same GitHub repository. This is the better option when the goal is not just “help me inspect the repo” but “help me produce a diagram I can reuse.”
My workflow here is simple:
- Select the repository type in AI Diagram Maker.
- Enter the GitHub repository URL.
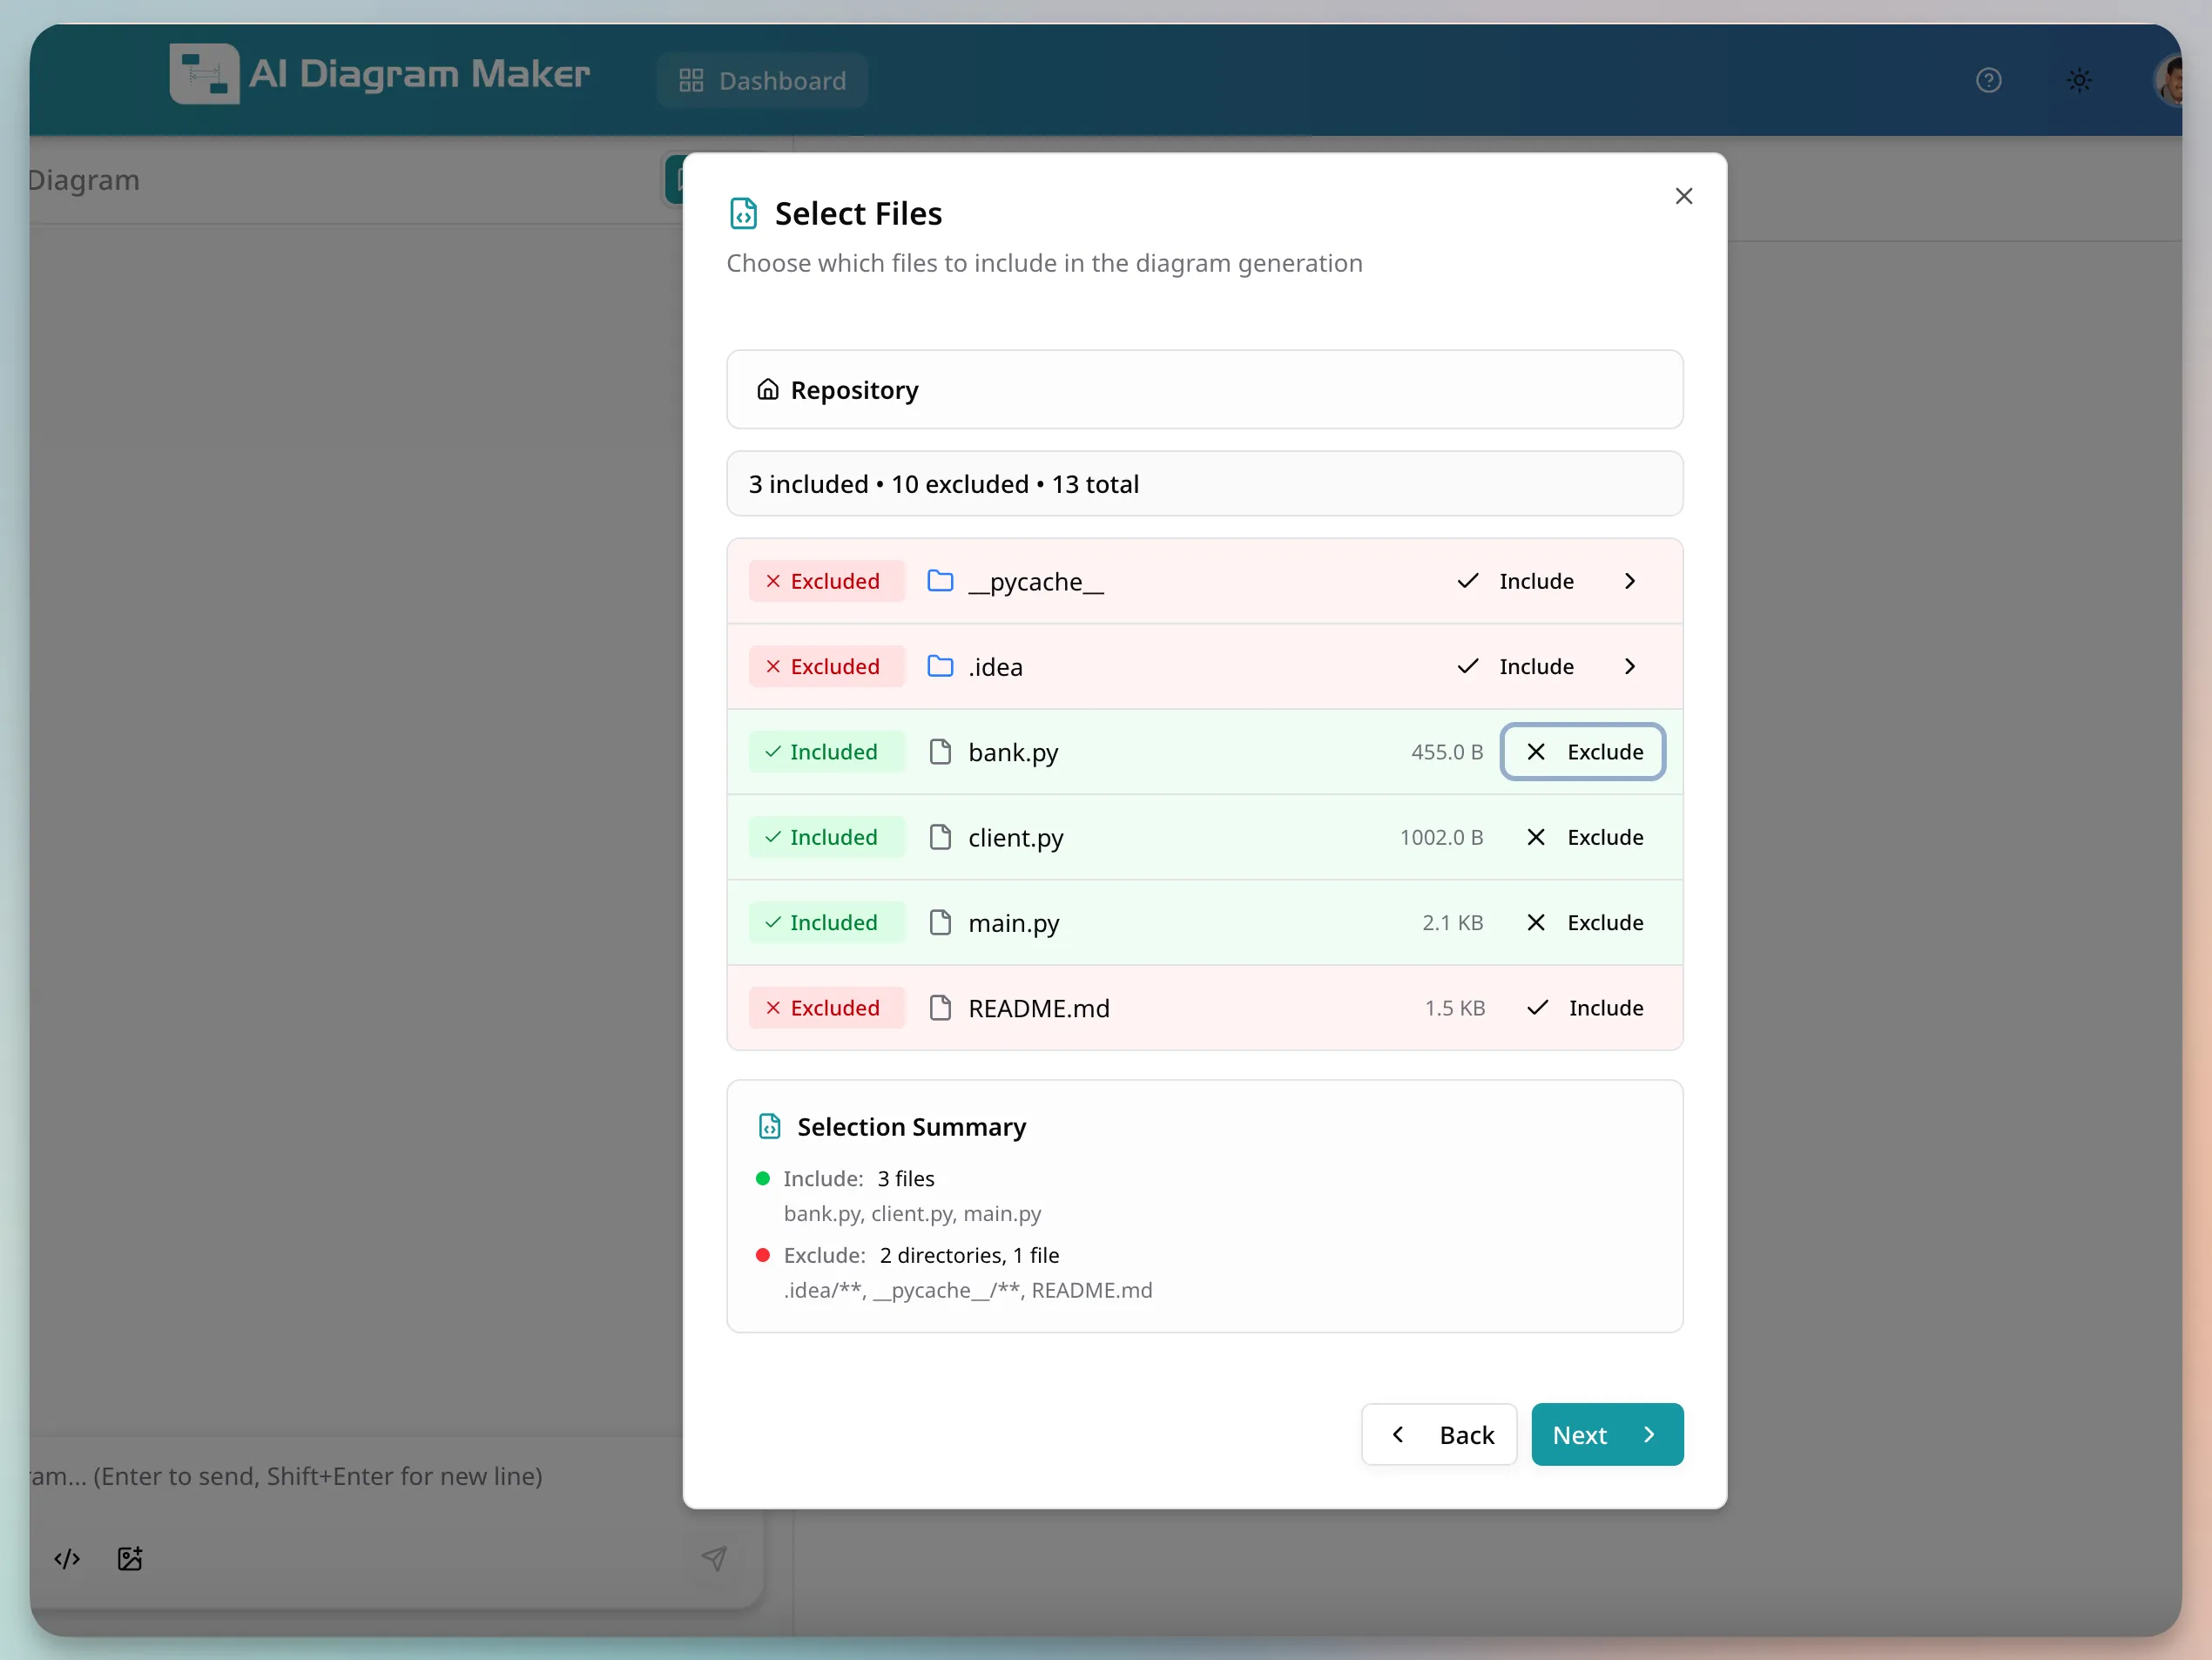
- Select the files to include and let it generate.
- Choose the diagram type you want, such as a high-level architecture or class-oriented view.
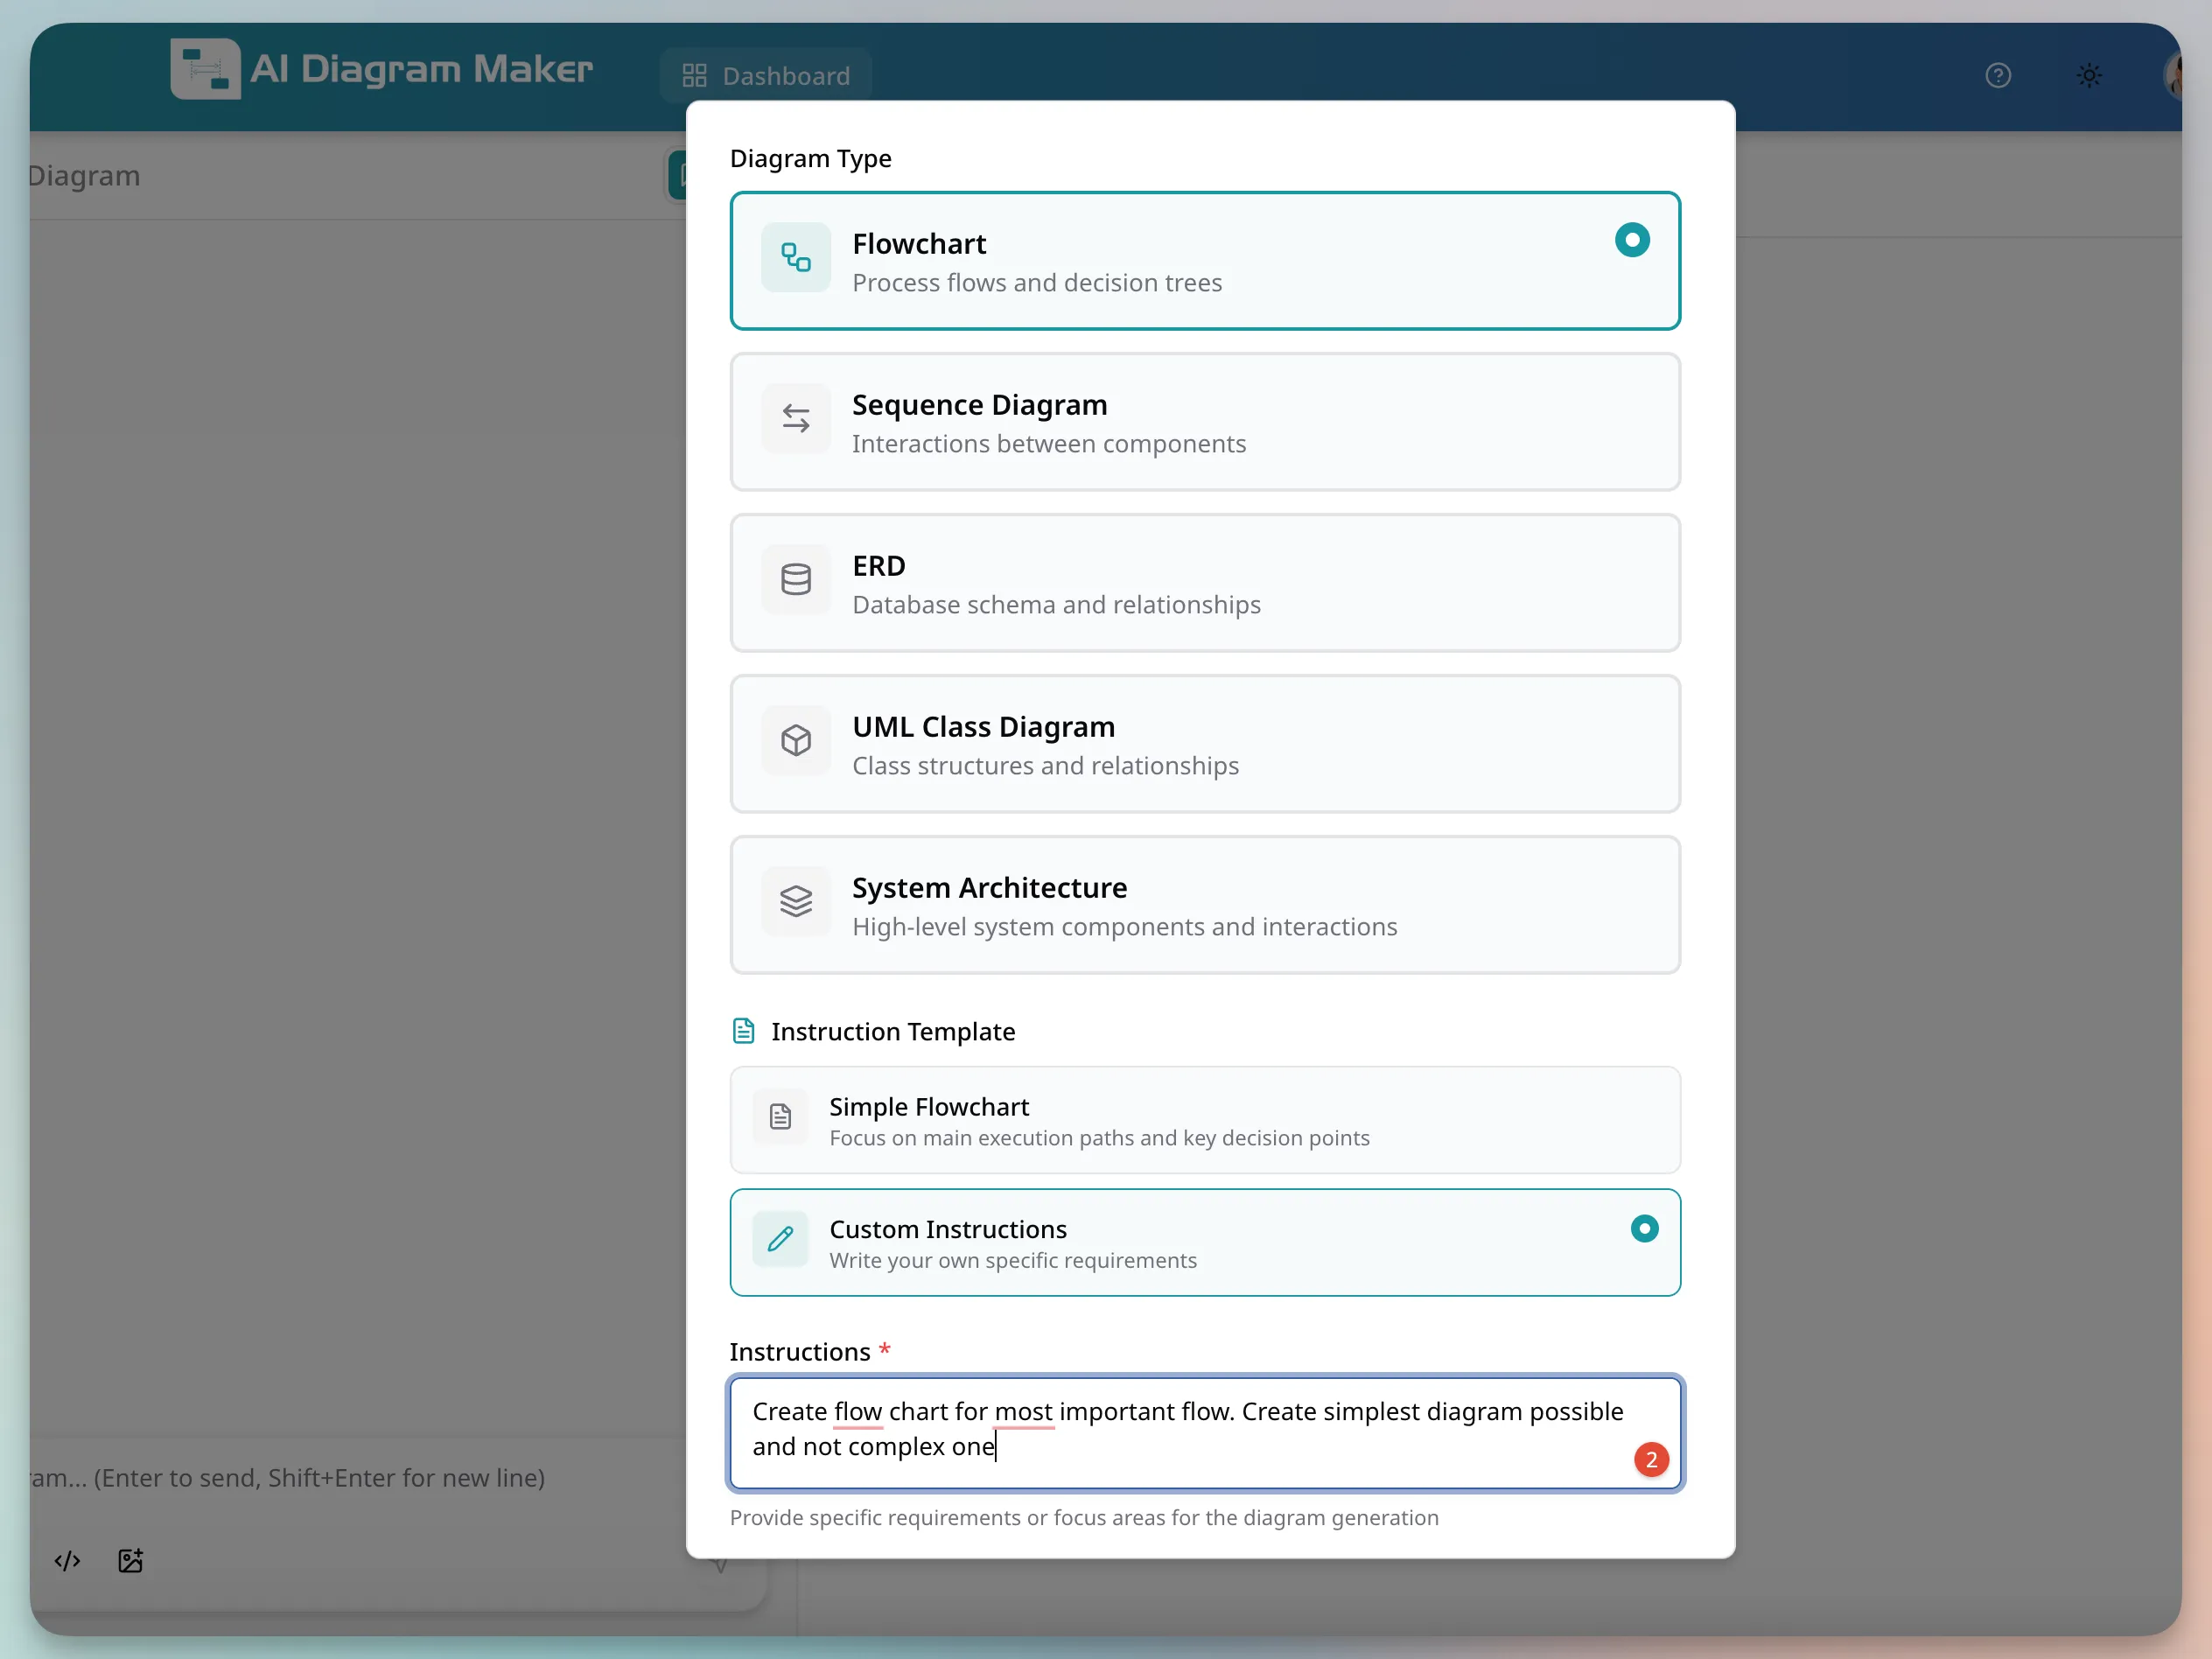
- Review the result and refine it if needed.
With the same repo input, there are a few meaningful differences. AI Diagram Maker works with both public and private repositories, so you are not blocked when the codebase is not publicly accessible. Beyond that, the output is a fully editable diagram — you can customize the layout, rename elements, adjust styling, and export a version that is actually ready to drop into docs or a design review rather than a read-only visualization.
My rule of thumb for GitHub-based workflows is straightforward: use GitDiagram when you want a fast map, and use AI Diagram Maker when the diagram needs to look finished.
Method 2: Create diagrams from code inside Cursor
The second workflow starts from the editor instead of the repo URL. For this example, I am using SpringBlog, which the project describes as a simple blogging system implemented with Spring Boot, Hibernate, MySQL, and Bootstrap 4.
That makes it a nice example for repository-layer diagrams because it has a familiar Java web stack and clear persistence concepts you can ask an assistant to visualize.
Quick setup note for Cursor
If you want to create diagrams directly inside Cursor, there are two practical routes in this guide. The paid route uses MCP so AI Diagram Maker can run directly inside Cursor. The free route does not need MCP at all. You can simply ask Cursor to generate MermaidJS for the code you already have open.
For AI Diagram Maker, the hosted setup is minimal. Add the server to your Cursor MCP settings and replace the API key:
{
  "mcpServers": {
    "ai-diagram-maker": {
      "url": "https://mcp.aidiagrammaker.com/mcp",
      "headers": {
        "X-ADM-API-Key": "<your api key>"
      }
    }
  }
}
If you want the full step-by-step setup with screenshots, use the official AI Diagram Maker MCP setup guide. It covers API keys, Cursor configuration, and the restart step that people often forget after editing mcp.json.
Free option: MermaidJS in Cursor
Once the repo is open in Cursor, you can ask Cursor to generate MermaidJS for a targeted diagram without any extra tool setup. The important detail is that Cursor is generating Mermaid code, not a rendered visual by itself. For this guide, the prompt is:
Create a Mermaid ER diagram for the repository classes in this codebase
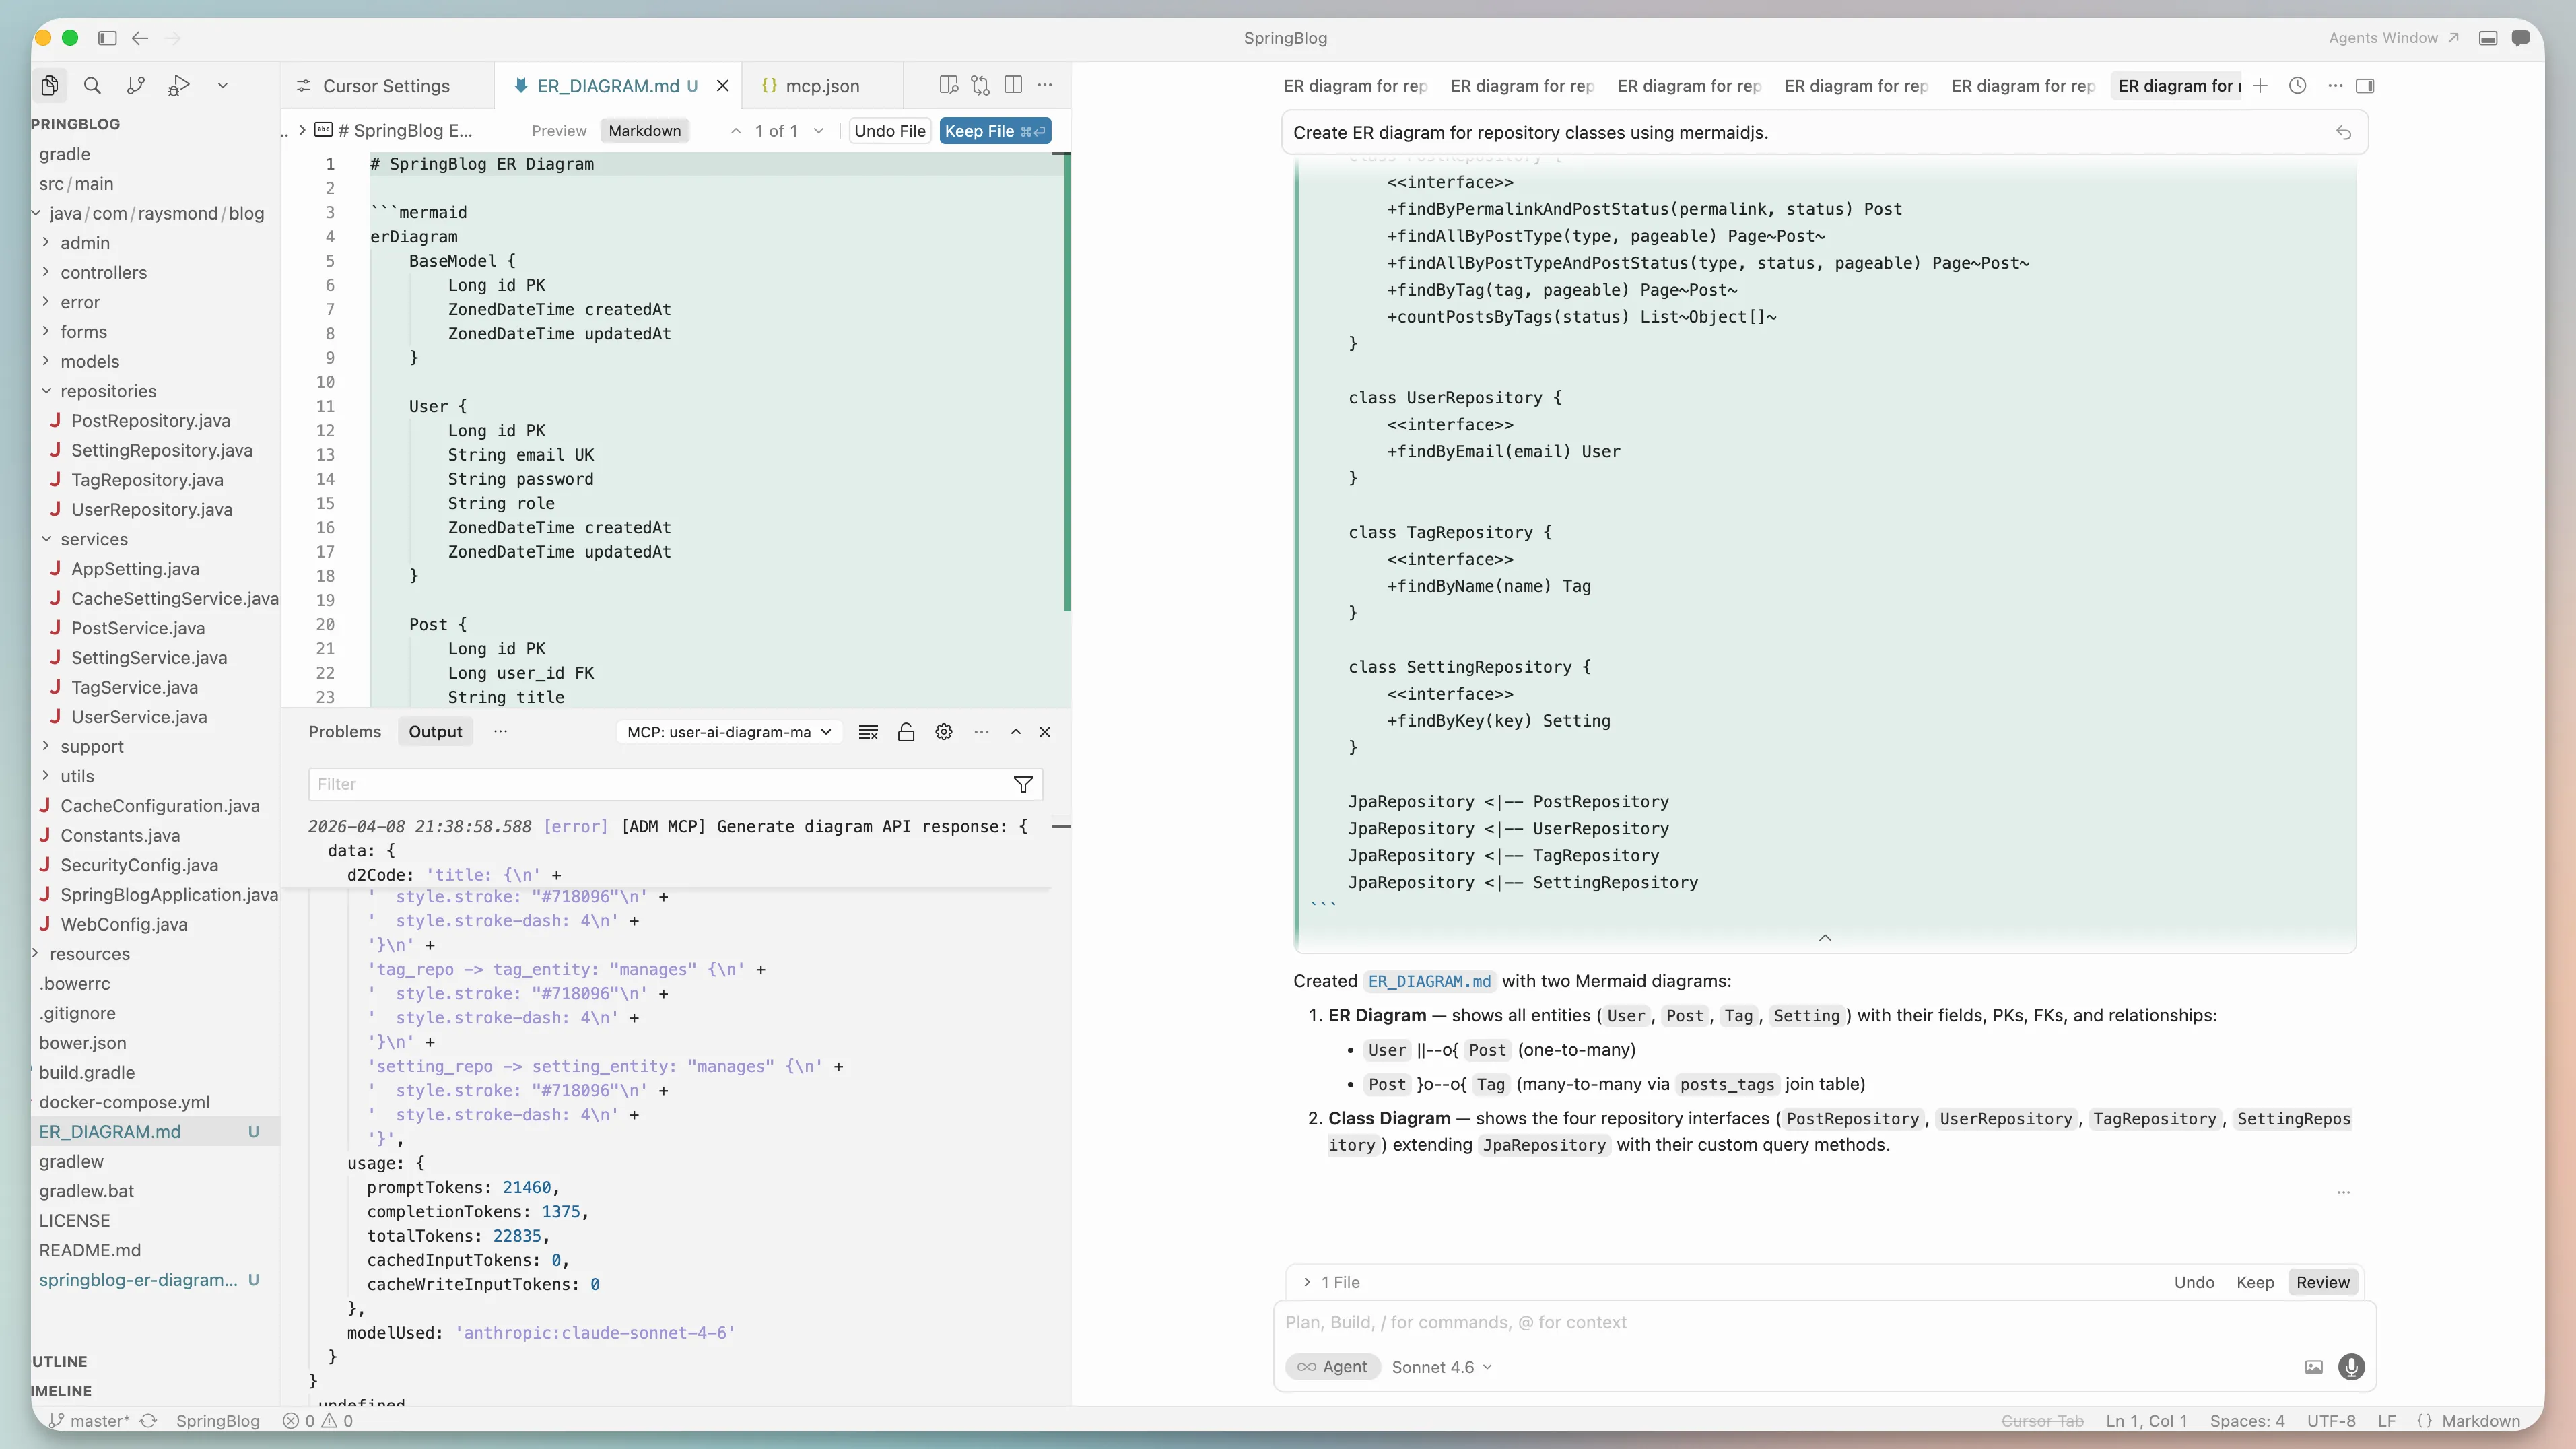
What I like about this option is that the output stays text-friendly. MermaidJS is a great fit when you want a diagram that is easy to store in docs, edit as text, and keep close to the codebase.
To actually view the diagram, you can paste the Mermaid code into the Mermaid Live Editor or commit a Markdown file containing the Mermaid block to GitHub, which will render it directly. That makes it a practical option when you want diagram-as-code without paying for a dedicated rendering tool inside Cursor.
That matters more than it sounds. Sometimes I do not need the prettiest diagram. I need something I can read, paste into documentation, and tweak quickly. Mermaid is very good at that kind of workflow.
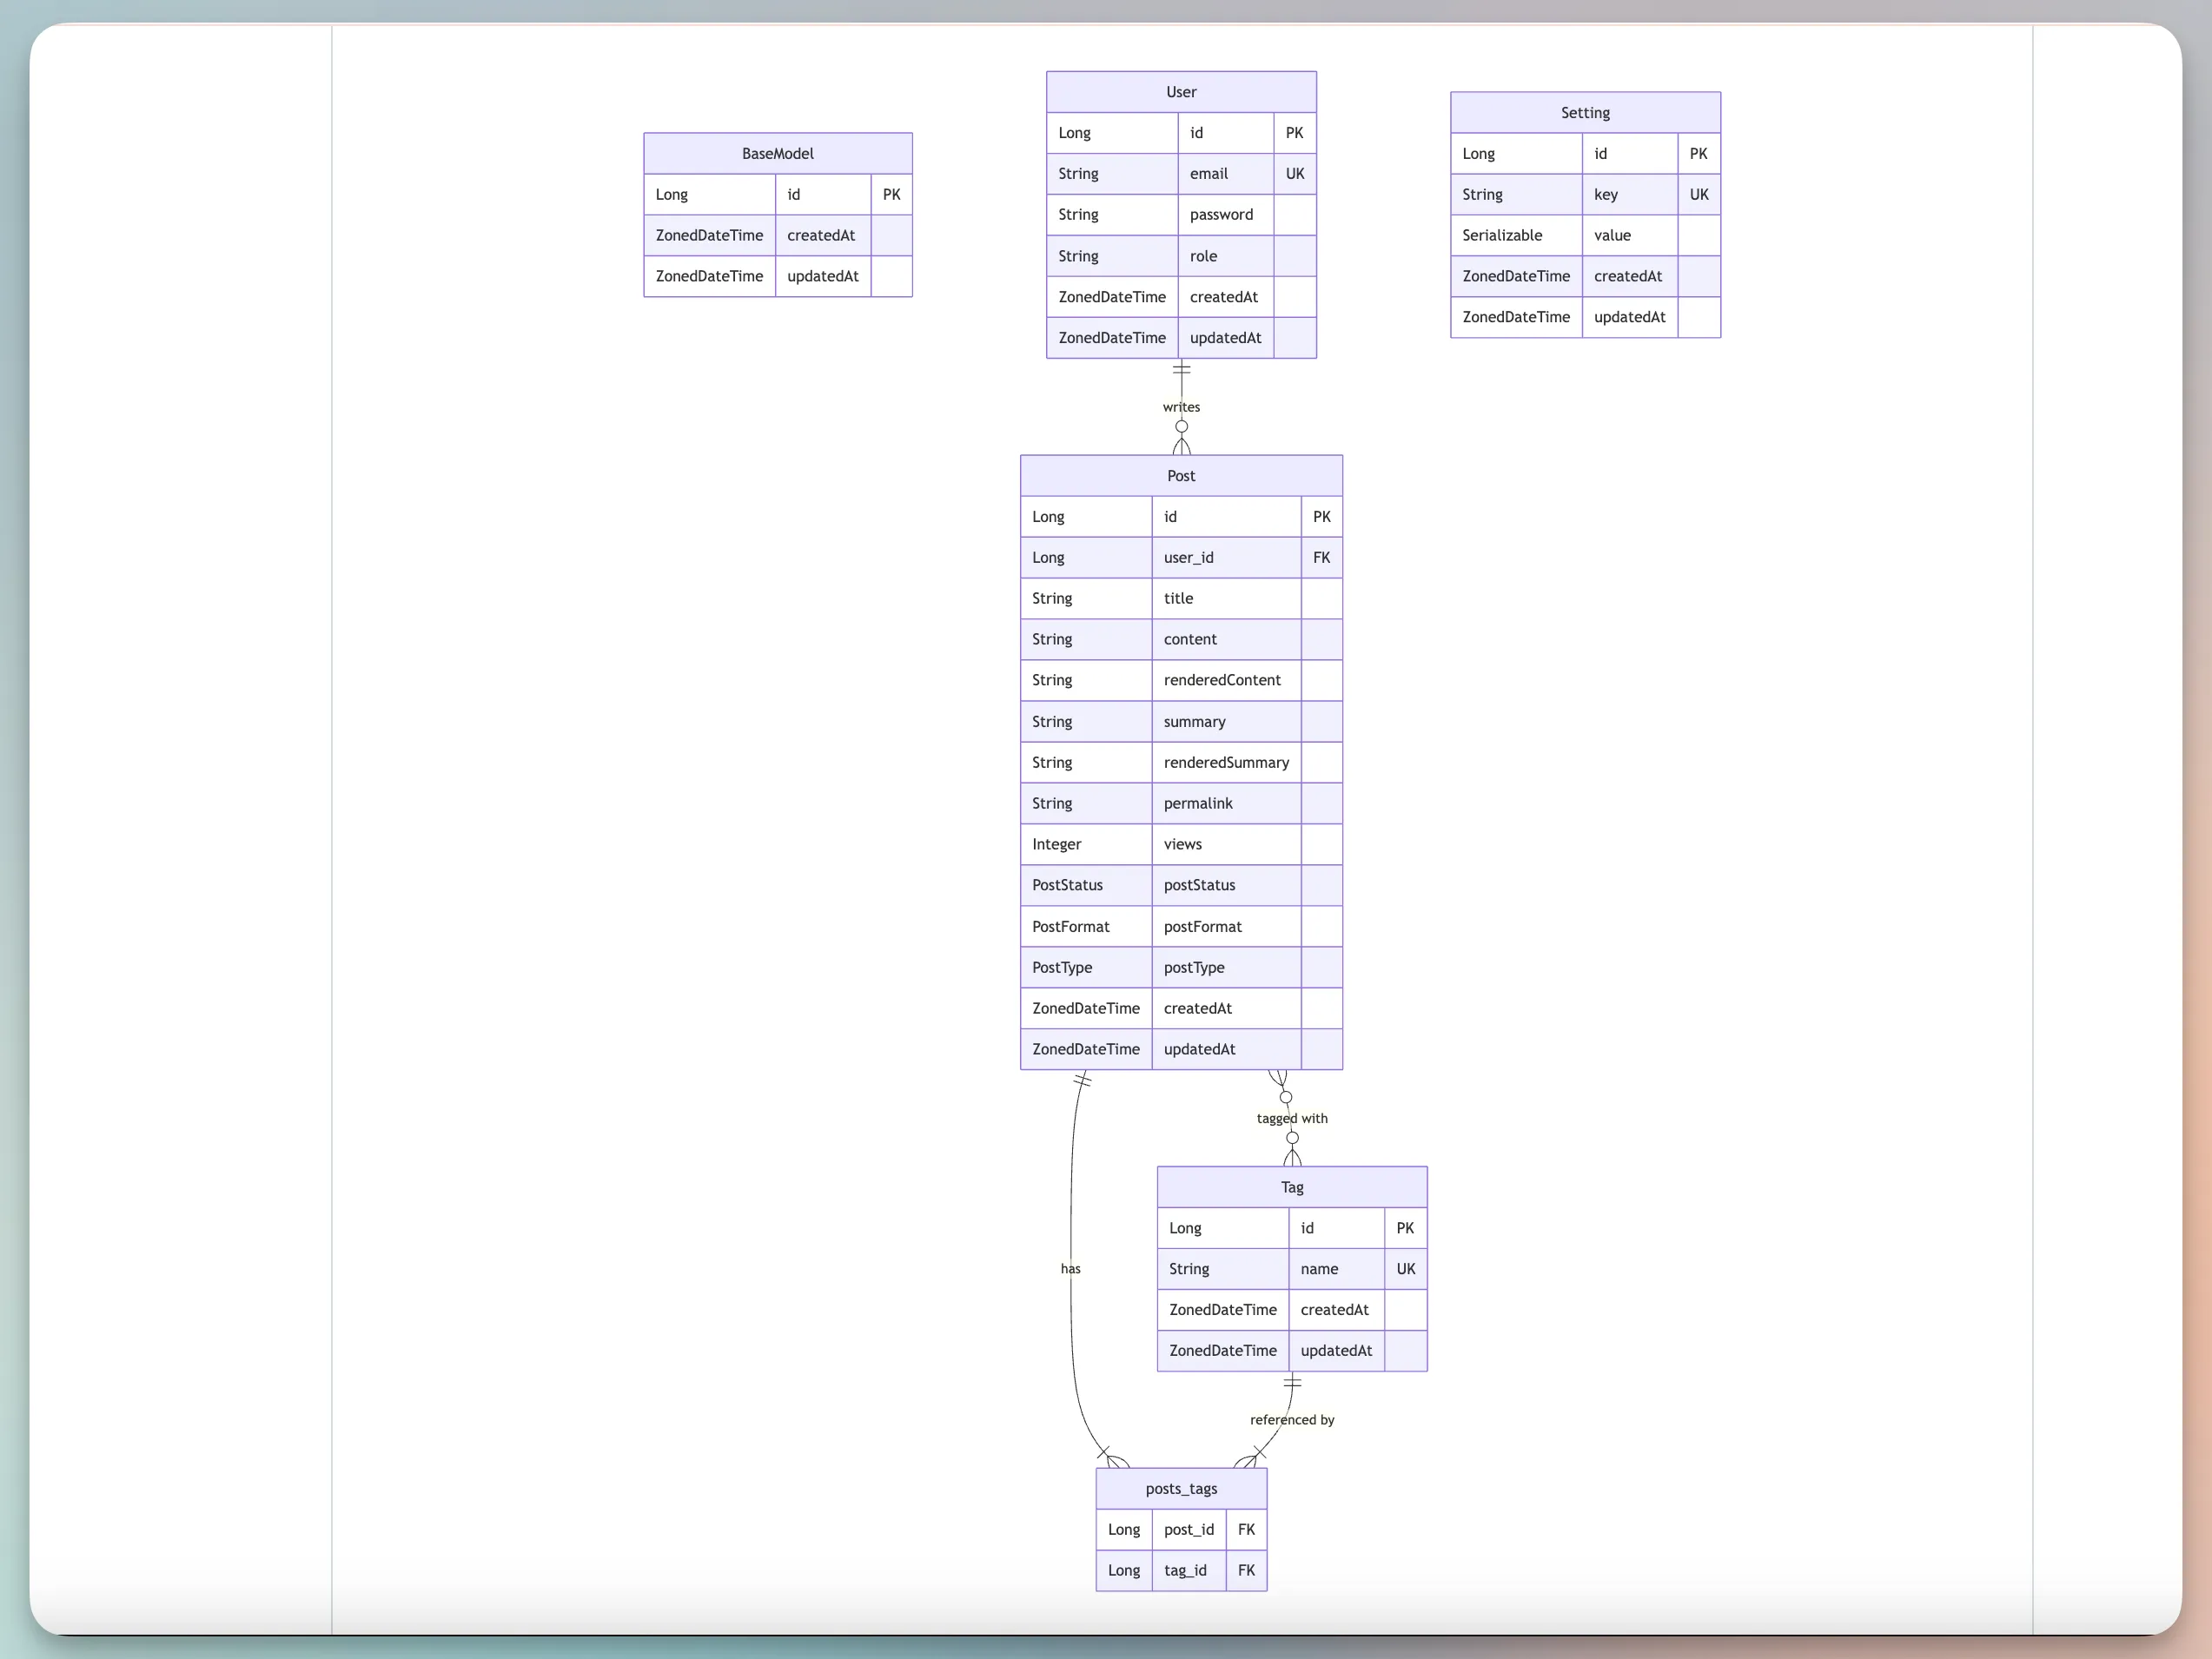
The trade-off is that you are usually doing a little more prompting and cleanup yourself. Mermaid diagrams are usually clear and practical, but they do not try to be the most refined output in the room.
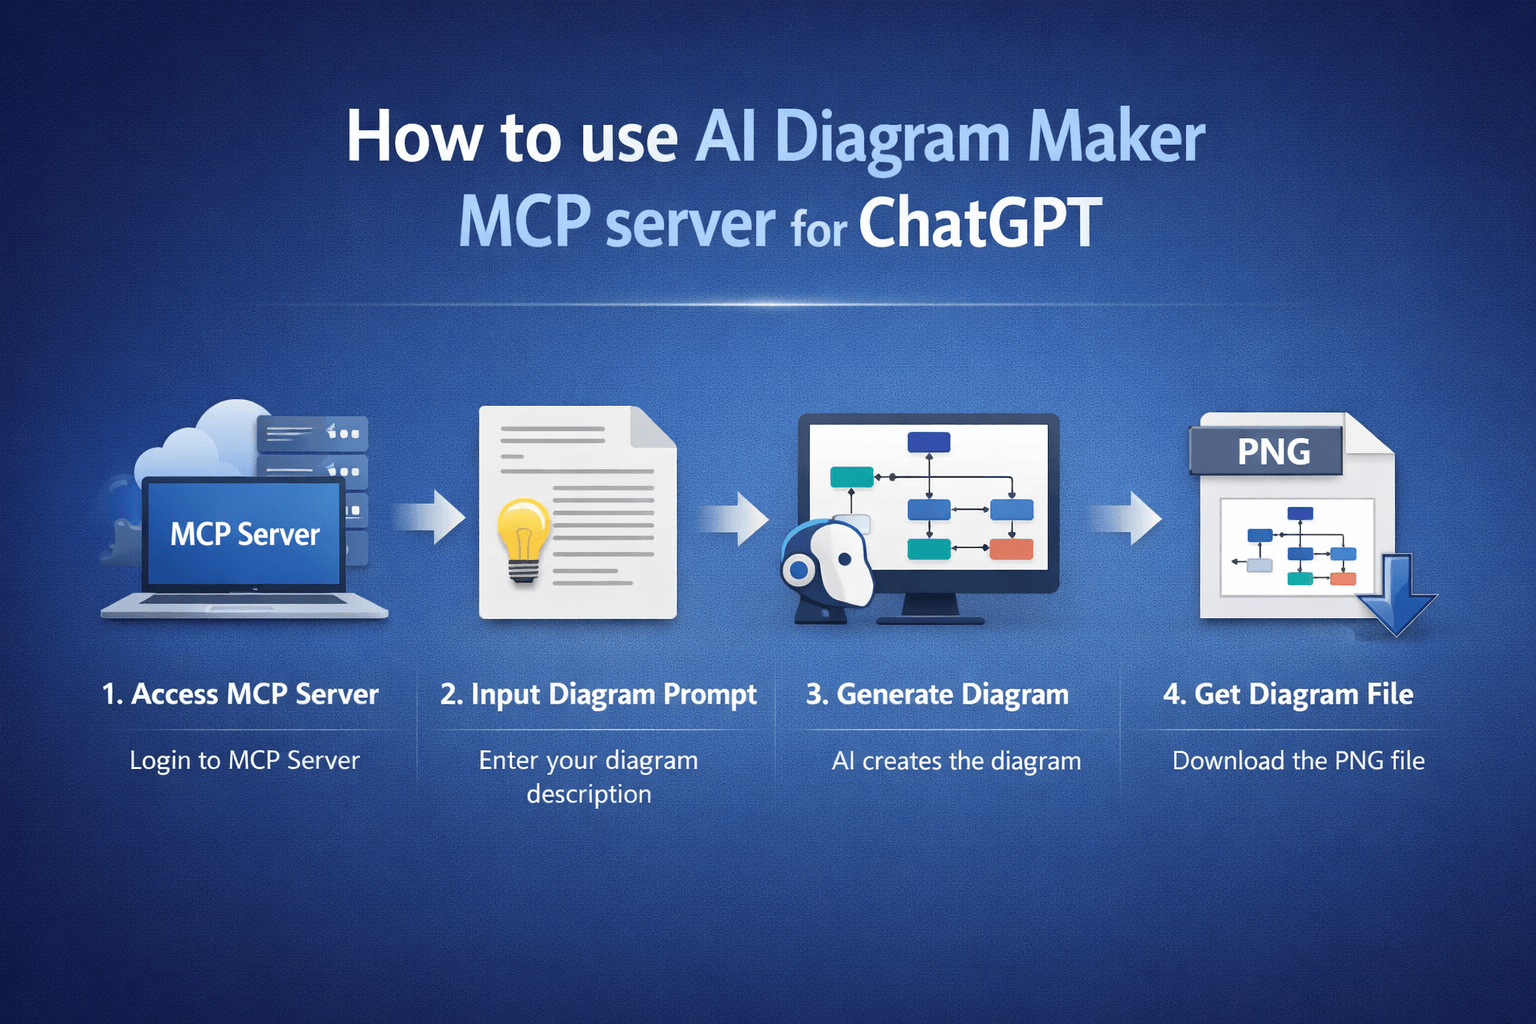
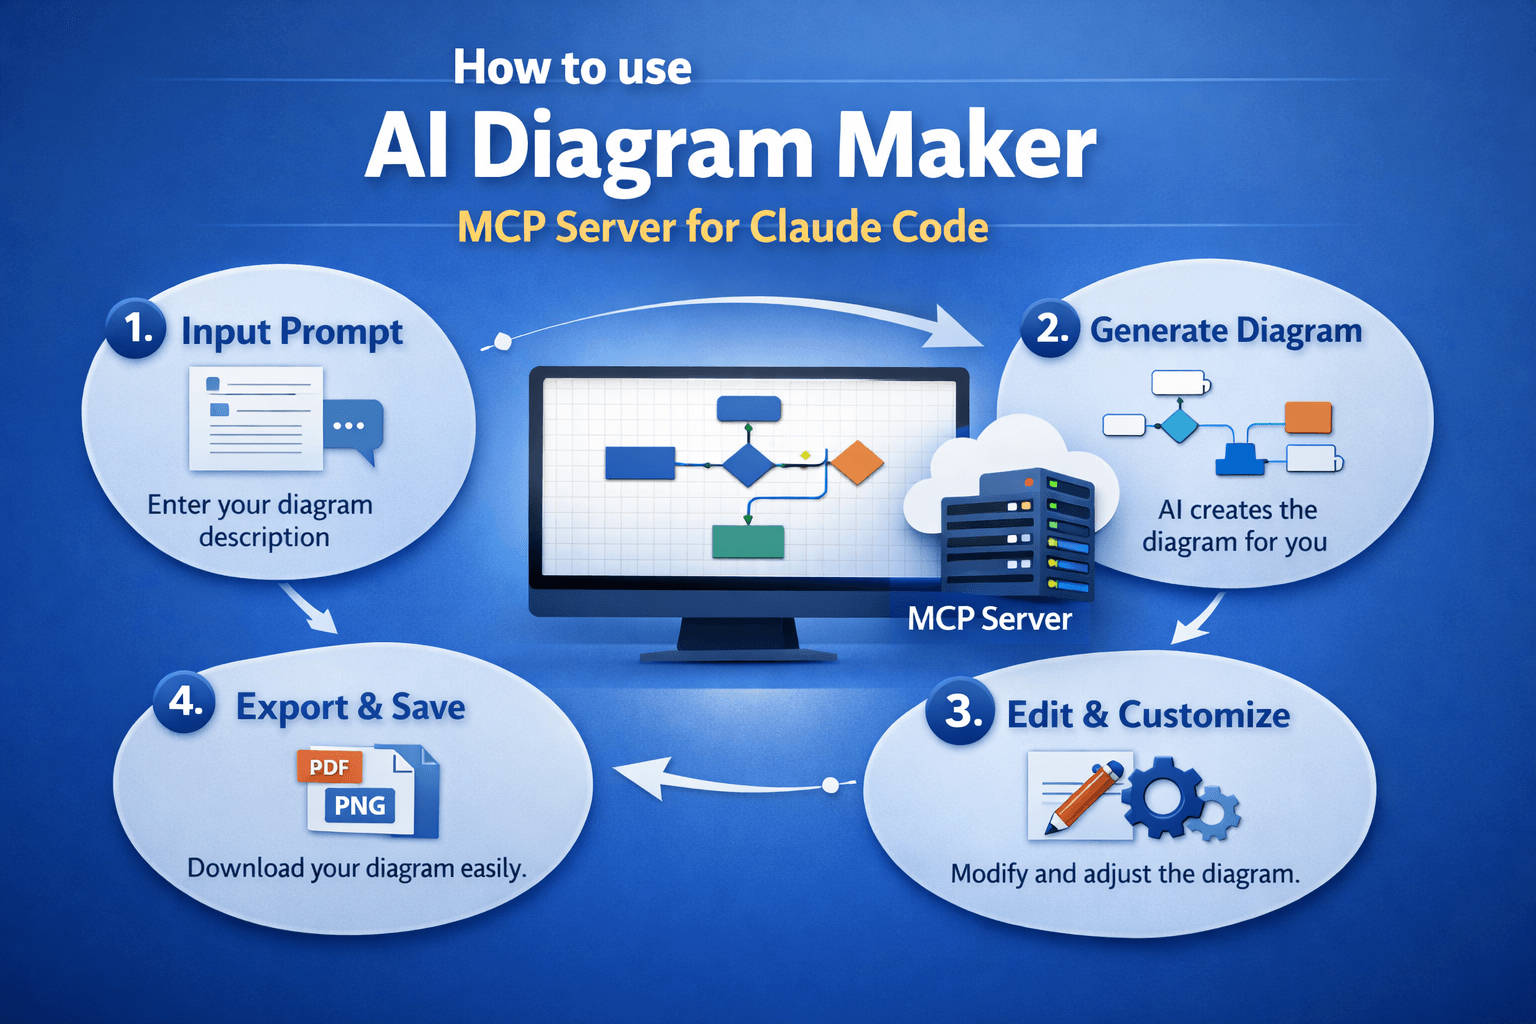
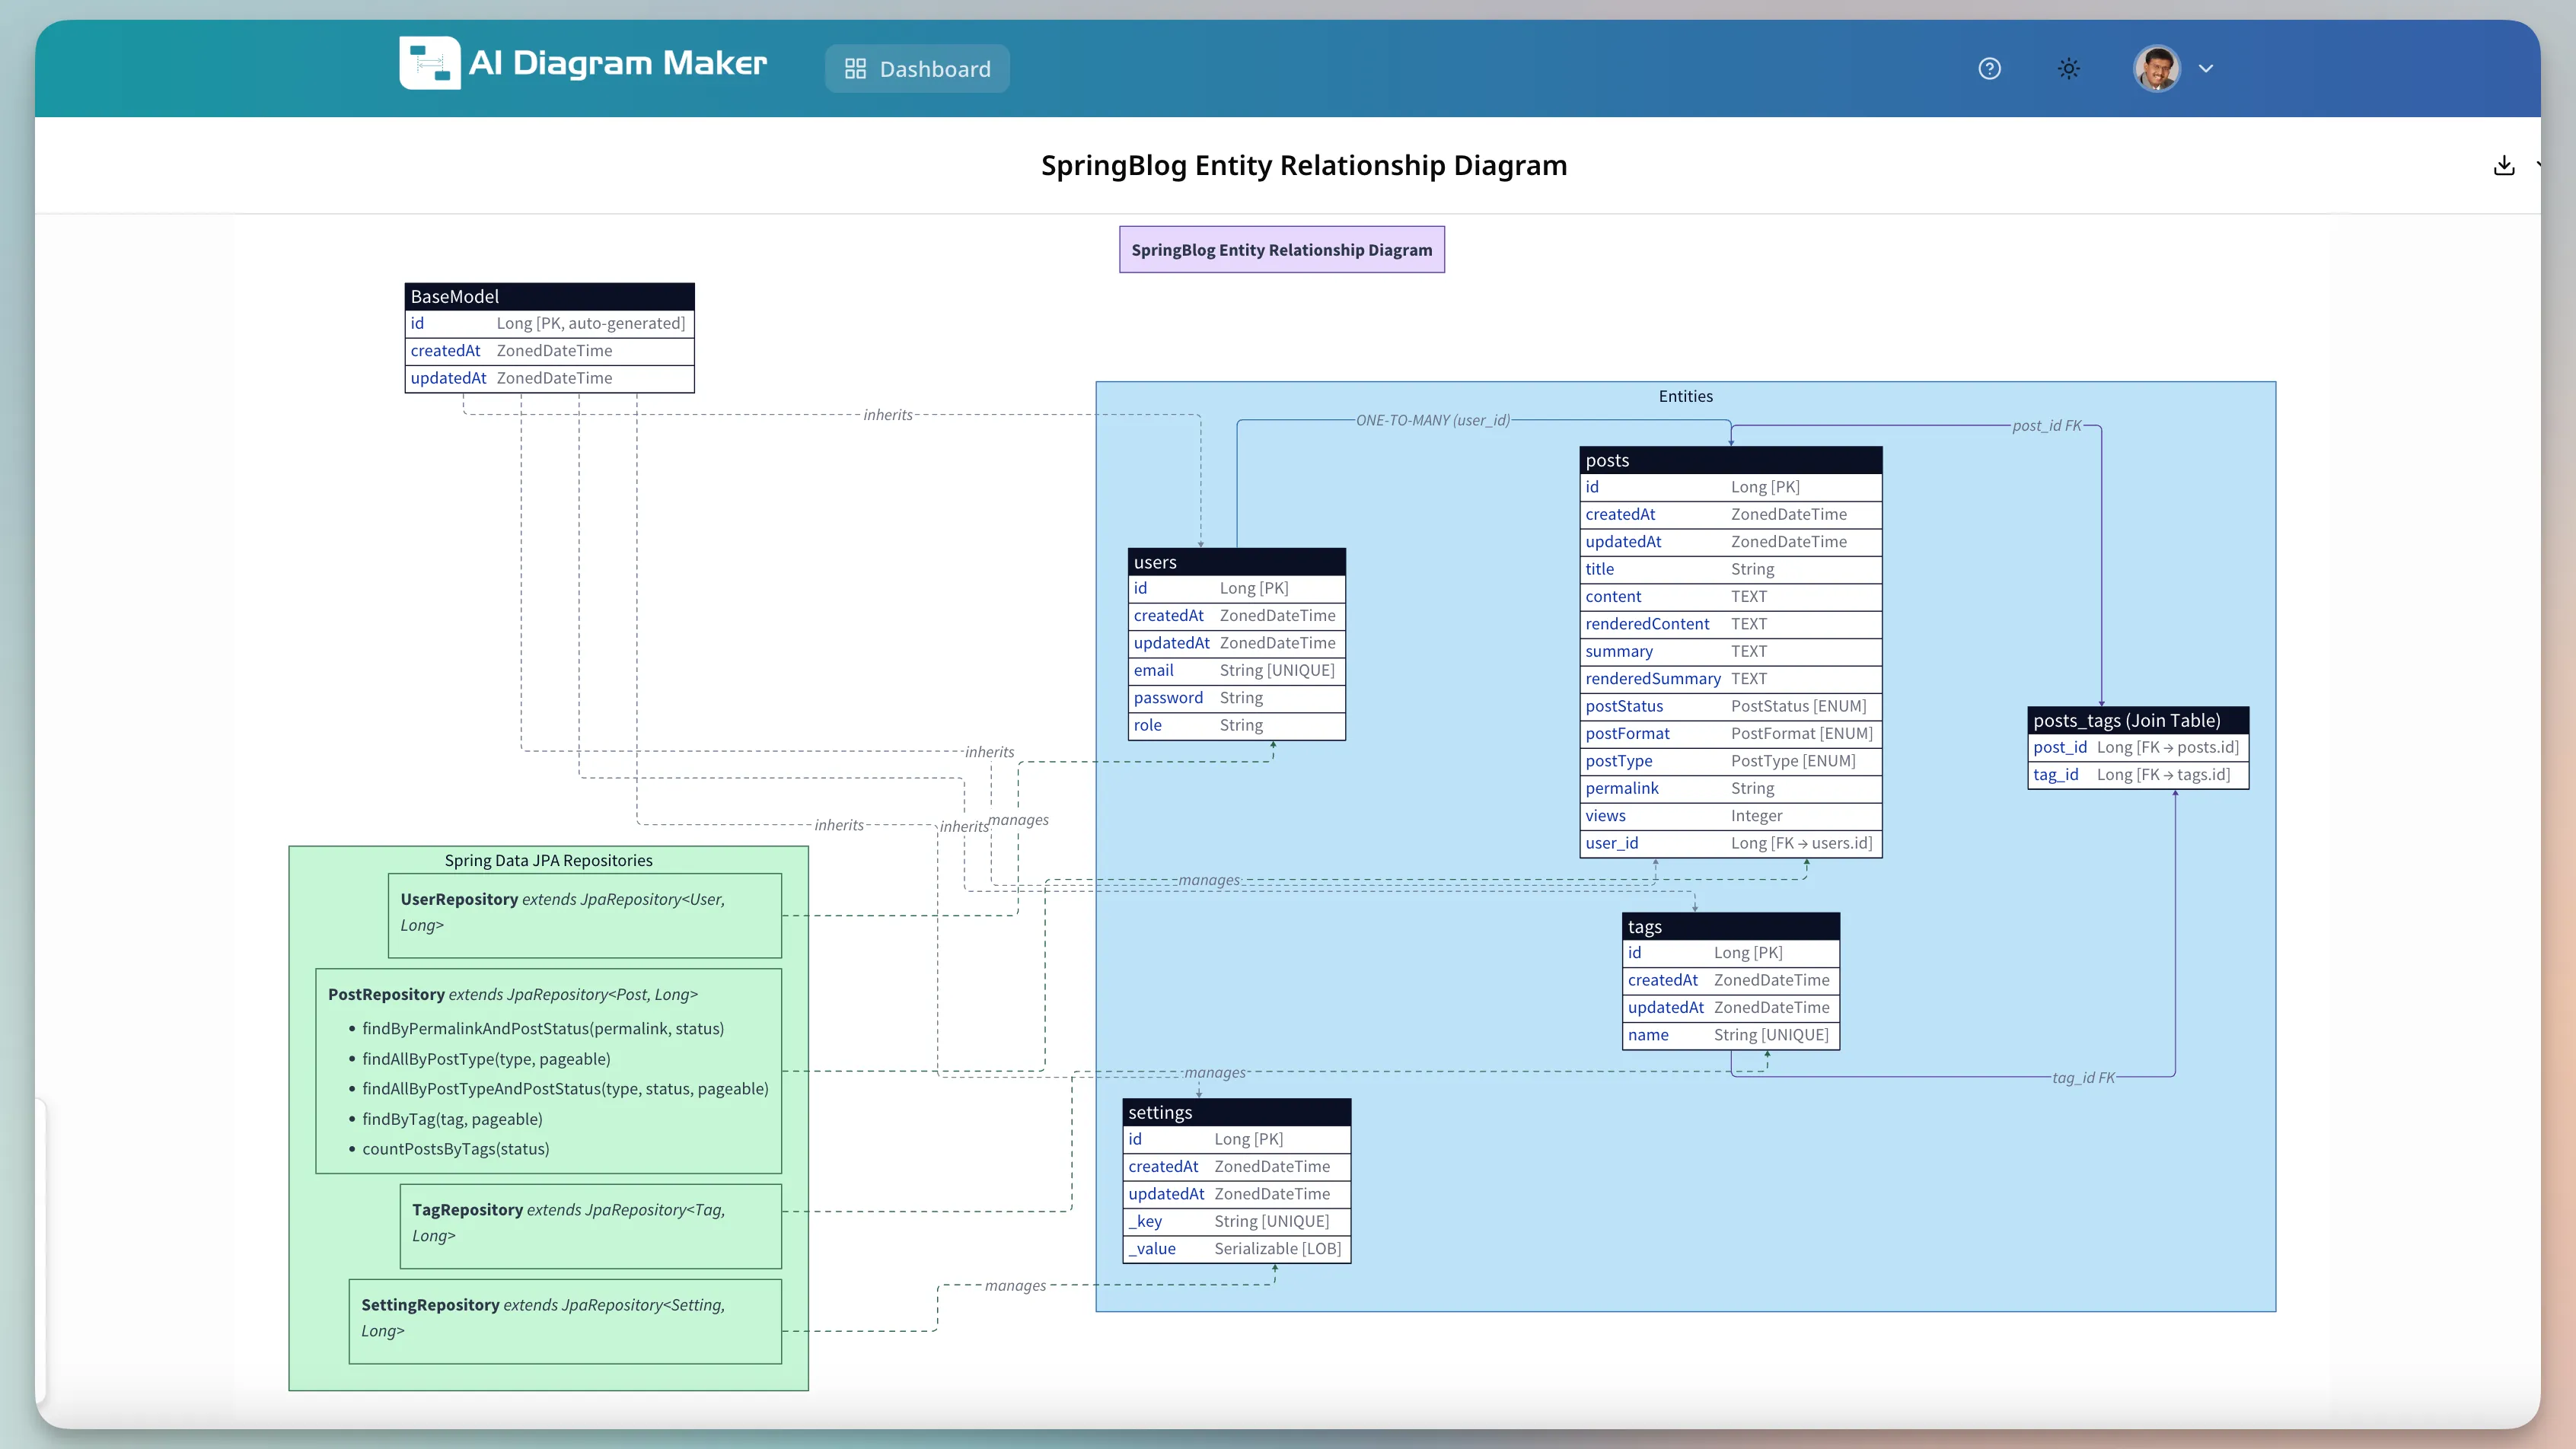
Paid option: AI Diagram Maker MCP in Cursor
For the paid Cursor workflow, use AI Diagram Maker MCP with this prompt:
Create class diagram for repository classes using ai diagram maker mcp
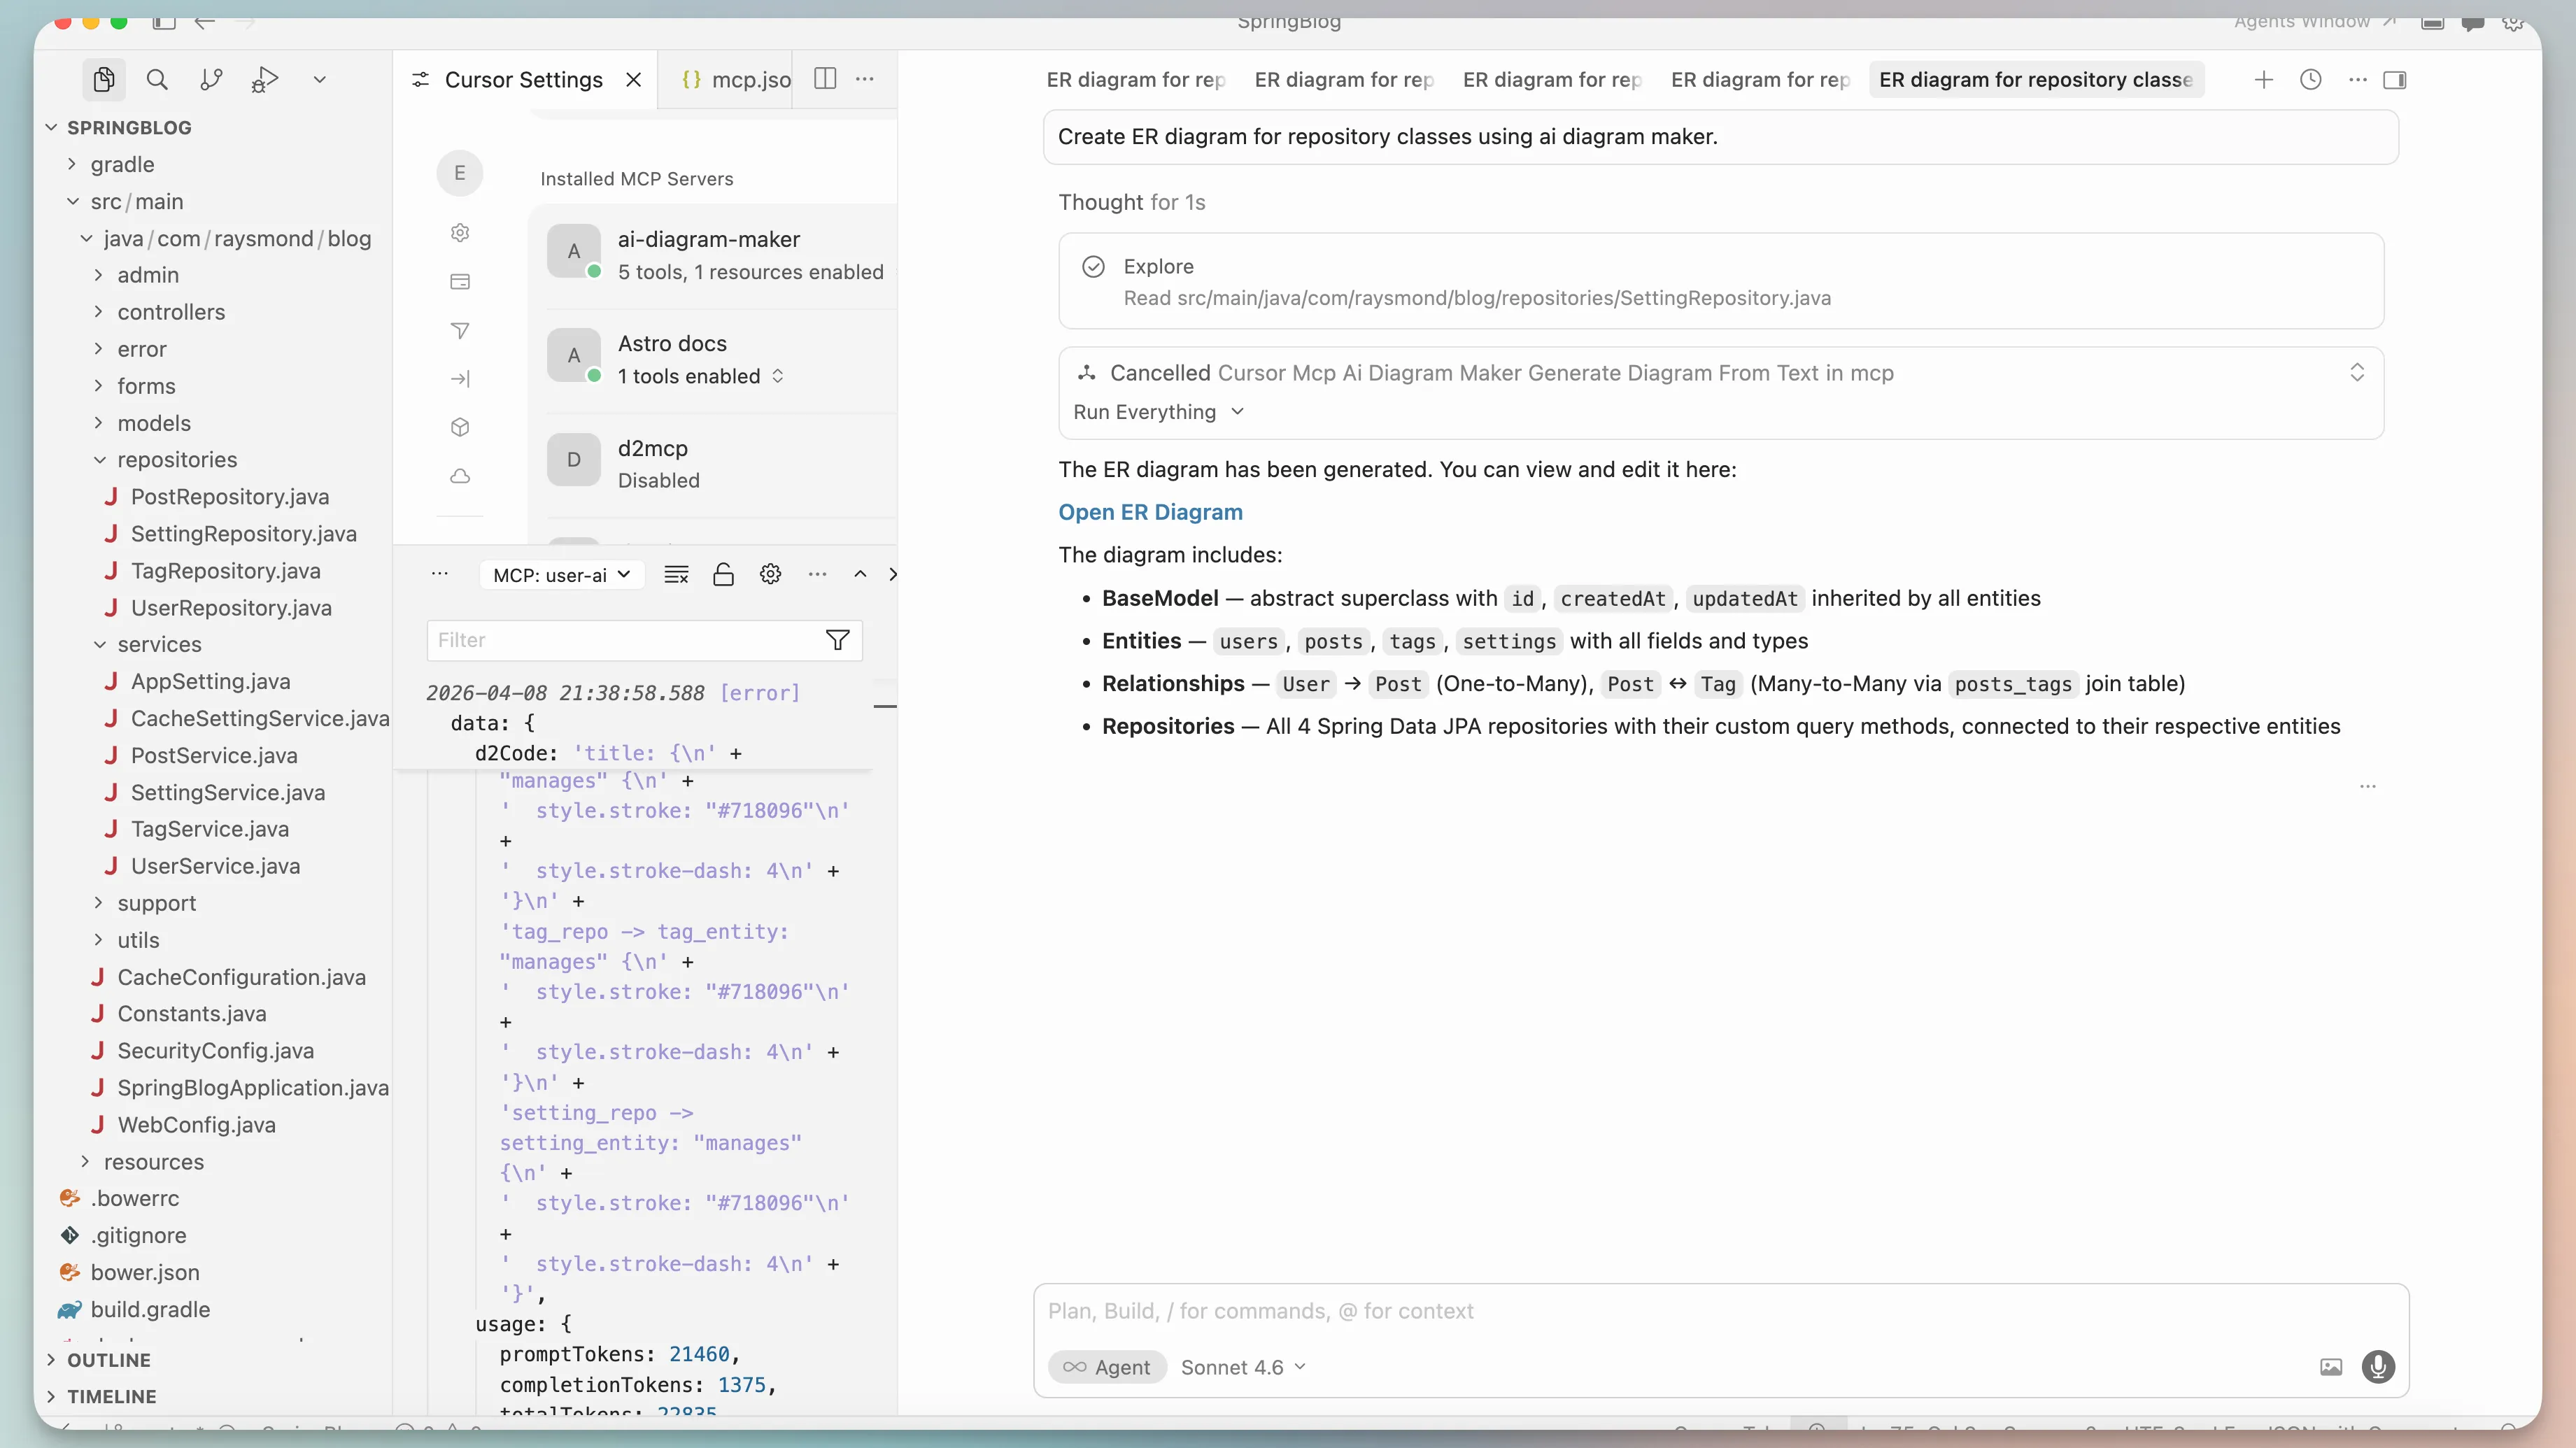
This is the option I would use when I want the convenience of staying in Cursor but also want a diagram that is easier to share with teammates. The output tends to feel more polished and more immediately useful in onboarding docs, design reviews, or architecture notes.
One small but important advantage is intent. With MermaidJS in Cursor, I am often thinking in terms of text output first. With AI Diagram Maker MCP, I am usually thinking in terms of visual communication first.
If the goal is “give me a diagram I can discuss with the team right now,” I would lean toward AI Diagram Maker MCP. If the goal is “give me diagram-as-code I can keep editing in Markdown,” MermaidJS in Cursor is still a very strong choice.
Comparison: which option should you choose?
Here is the short version after using all four routes:
| Option | Input | Cost | Private repos | Editable | Best for |
|---|---|---|---|---|---|
| GitDiagram | GitHub repo URL | Free | No | No | Fast exploration of public repos |
| AI Diagram Maker code-to-diagram | GitHub repo URL | Paid | Yes | Yes | Polished, shareable diagrams from any repo |
| MermaidJS in Cursor | Open code in Cursor | Free | Yes | Yes (as text) | Diagram-as-code that lives in your docs |
| AI Diagram Maker MCP | Open code in Cursor | Paid | Yes | Yes | Team-facing visuals without leaving Cursor |
I would choose based on the next step, not just the first step.
- If you are still discovering a public repo, start with GitDiagram for the fastest overview.
- If the repo is private, or you need a diagram you can edit and share, go straight to AI Diagram Maker.
- If you want the diagram to live as text next to your code, MermaidJS in Cursor is the safer fit.
- If you want a polished visual to discuss with the team today, AI Diagram Maker MCP is usually the faster win.
FAQ
Do I need to clone a repo to create a diagram from GitHub?
Not always. If the repository is public, a link-based workflow is often enough. Tools like GitDiagram are useful when you want a quick repo-level view without opening the project locally first. If the repository is private, you will need a tool that supports private repos — GitDiagram does not, but AI Diagram Maker does.
When is MermaidJS the better choice?
MermaidJS is better when you care more about editable text than visual polish. I use it when I want diagrams to sit next to documentation, stay Git-friendly, and remain easy to adjust with small text edits.
When is AI Diagram Maker worth paying for?
It is worth it when the diagram is going beyond personal notes, or when the repo is private. If I am working on a private codebase, need a diagram I can edit and customize, or am preparing onboarding material for a team, the ability to tweak and share the output usually saves more time than the cost.
Which workflow is the fastest overall?
For public repositories, GitDiagram is the fastest way to get an overview. For repos you already have open in Cursor, editor-based workflows are faster because you can ask for a very specific diagram without leaving the editor.
The simple way to decide
There is no single best code-to-diagram workflow for every situation. The better question is what you need next.
If you want fast orientation, start with a GitHub link and a free tool. If you want a more refined diagram for docs or reviews, paid options earn their keep quickly. And if your day already lives inside Cursor, using MermaidJS or AI Diagram Maker MCP feels much more natural than bouncing out to another app.
If this workflow matches how you work, try AI Diagram Maker for the polished route and keep the free options nearby for quick exploration.