· API Design · 4 min read
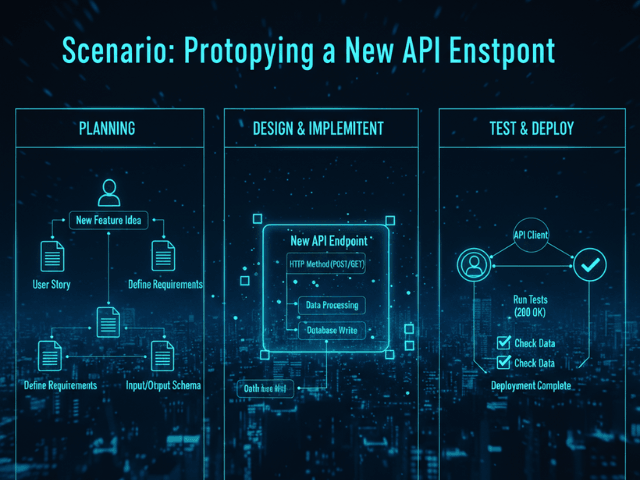
Scenario: Prototyping a New API Endpoint
This scenario explores how to align frontend and backend teams by prototyping API endpoints and JSON payloads visually using AI Diagram Maker before coding.
You are a Backend Developer. You are sitting in a planning meeting with the Frontend Lead. You are discussing a new feature: “Wishlist.” Users should be able to add items to a wishlist. They should be able to view it. They should be able to move items to the cart. “Just give me an endpoint,” the Frontend dev says. “Sure,” you say. “I will make POST /wishlist.” You both leave the meeting thinking you agree. But you don’t. You think POST /wishlist takes an itemId. They think it takes a full Item object. You think it returns a 201 Created. They think it returns the updated list. You are about to waste three days building the wrong thing. You need to prototype the contract.
The Situation: Frontend Needs a New Data Route
Verbal agreements are dangerous in API design. Words are vague. JSON is specific. If you start coding now you will build the backend logic. The frontend will build the UI mockups. Next week when you try to connect them nothing will work. “Why am I getting a 400 Bad Request?” they will ask. “Because you forgot the userId,” you will answer.
The Goal: Agree on the Logic Before Coding
You want to define the logic visually. You want to show exactly what data is needed and what steps the server takes. You want to “Fail Fast” on the design not the implementation.
The Workflow:
Here is how you use AI Diagram Maker to align the team in five minutes.
Typing the Request/Response Flow
You open the tool. You start typing the flow. “Client sends POST /wishlist with itemId. Server checks if user is logged in. If not return 401. If yes check if item exists. If not return 404. If yes add to DB and return 200 OK.” The AI generates a Flowchart. You show it to the Frontend dev. “Wait,” they say. “If the user isn’t logged in don’t return 401. We want to store it in local storage. Can we merge it later?” You catch the requirement gap instantly.
Visualizing the JSON payload logic (Class Diagram)
Then you tackle the data. You paste the proposed JSON response structure into the tool. “Visualize this JSON: {'wishlist': [{'id': 1, 'name': 'Shoe'}]}” The AI draws a simple Class Diagram showing the structure. “Do we need the price here?” the Frontend dev asks looking at the box. “Yes,” you say. “I will add it.”
Below are example diagrams produced from the prompts above.
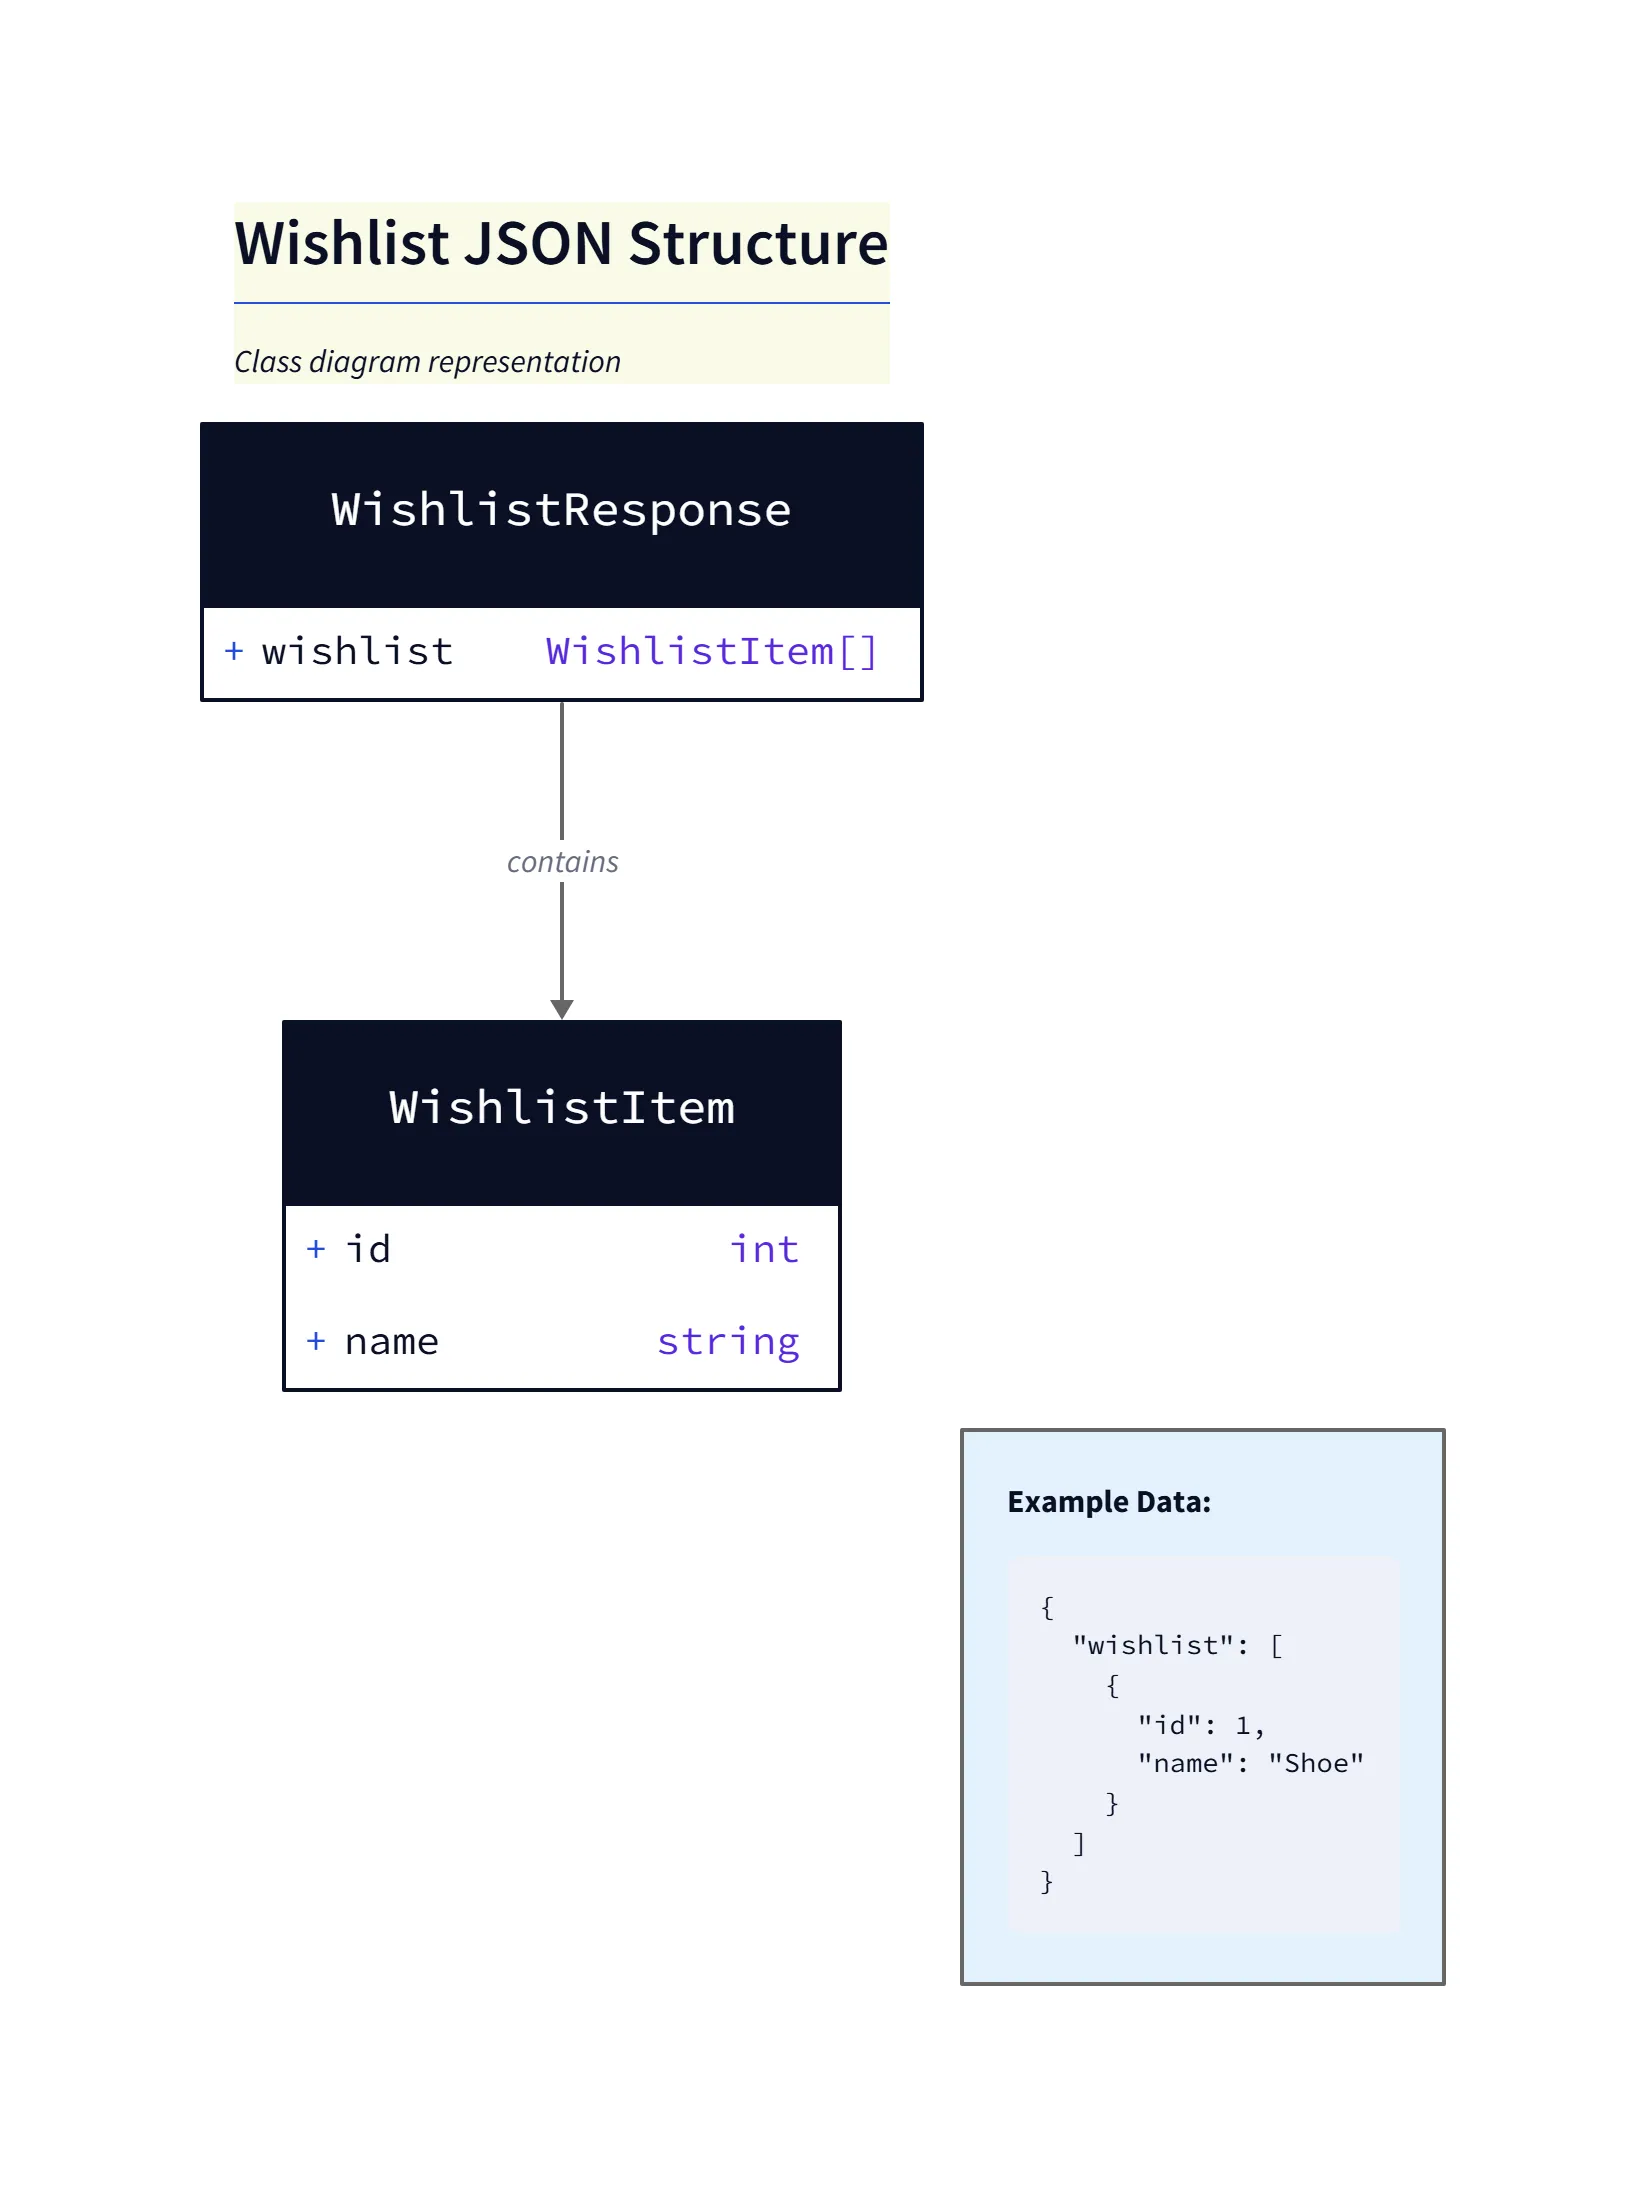
Wishlist JSON Diagram Explanation
- Structure: The diagram shows a
WishlistResponseobject that contains awishlistarray ofWishlistItemobjects. - Fields: Each
WishlistItemhasid(integer) andname(string) fields representing the minimal data returned to the client. - Usage: This structure maps directly to the JSON example used in the prompt and is useful for aligning frontend expectations about the payload shape.
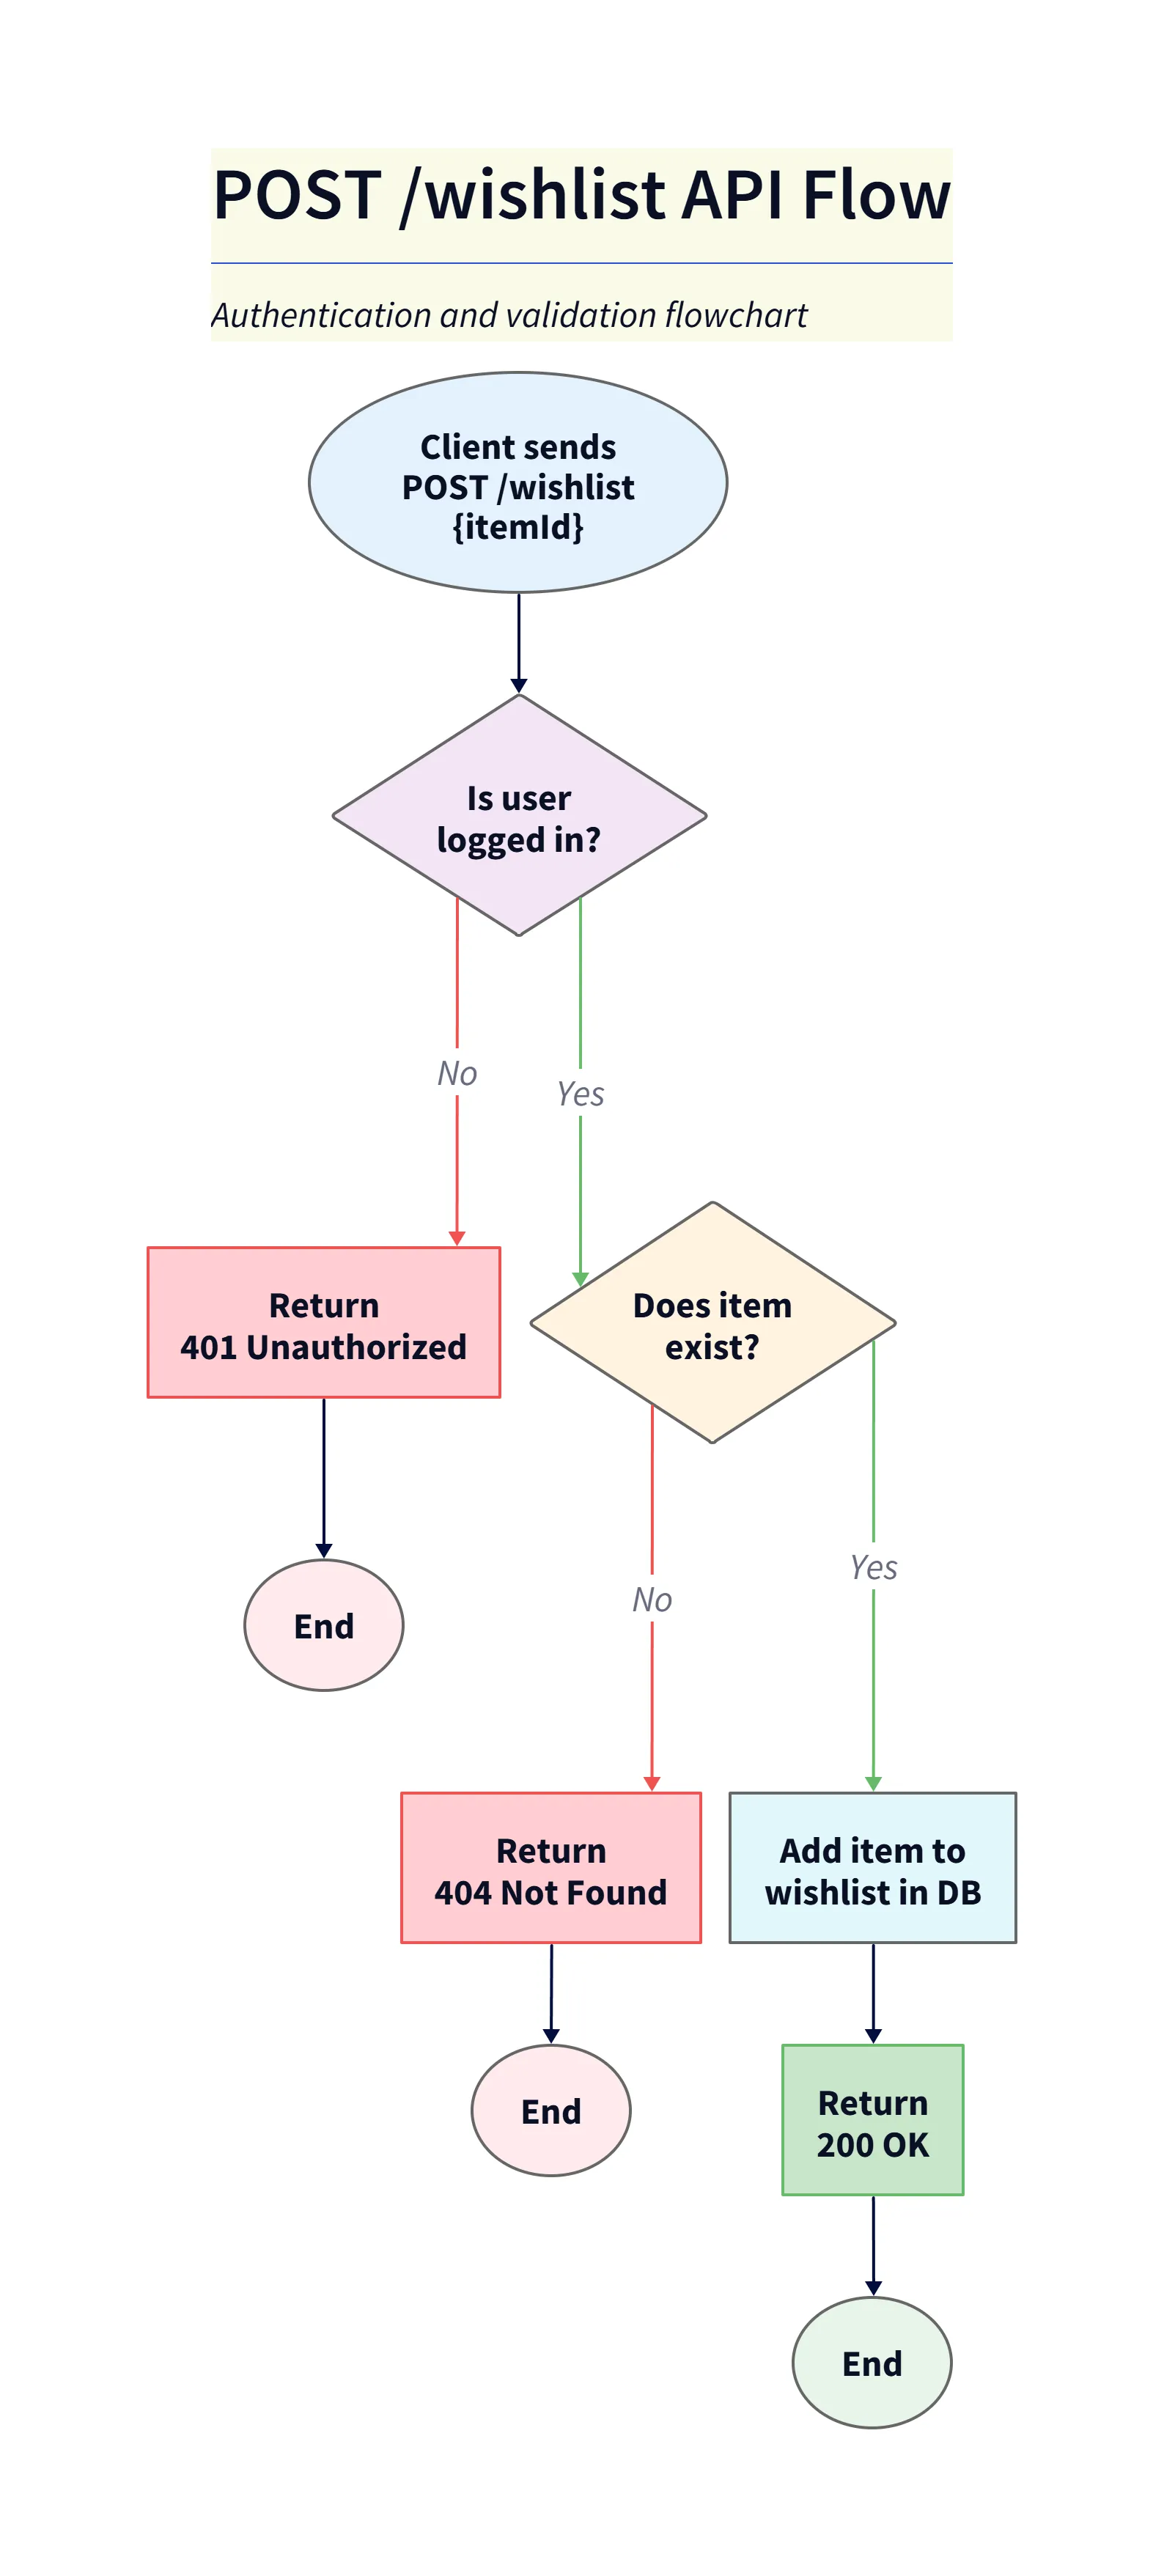
POST /wishlist Flowchart Explanation
- Start: Client sends
POST /wishlistwithitemIdin the request body. - Auth check: If the user is not logged in the flow returns
401 Unauthorized(end). If logged in, the server validates the item. - Validation: If the item doesn’t exist the flow returns
404 Not Found. If it exists the item is added to the wishlist in the database and the server returns200 OK. - Purpose: This flowchart documents the request/validation/result sequence so frontend and backend teams share the same contract.
The Result: Frontend/Backend Alignment
You update the diagram. You export it. You paste it into the Slack channel. “Here is the contract,” you say. Now you can both go build. You build the endpoint to match the diagram. They build the UI to match the diagram. When you connect them next week it just works.
Prototype your API. Stop arguing about JSON schemas over Zoom. Use AI Diagram Maker to visualize your API logic before you write a single line of controller code. It is the fastest way to get to “200 OK.”
The Programmable Diagram: A Developer’s Guide to D2 and Text-Based Visuals
To learn more about the tools used to create these prototypes, check out our guide: The Programmable Diagram: A Developer’s Guide to D2 and Text-Based Visuals.