· Glossary · 5 min read
What Is an ERD (Entity Relationship Diagram)?
An Entity Relationship Diagram (ERD) is the visual blueprint of a database structure. Learn how ERDs use entities, attributes, and relationships to map out complex data models.
In the world of software development data is king. But raw data is messy. It needs structure. An ERD or Entity Relationship Diagram is the visual blueprint of that structure.
Simple Definition of an Entity Relationship Diagram
Think of an ERD as a map of your database.
If you were building a house, you would need a floor plan to show where the kitchen is relative to the bedroom. You would need to know where the doors are to connect the rooms.
An ERD (Entity Relationship Diagram) does the exact same thing for software. It identifies the “things” in your system: we call these Entities. It lists the details about those things: we call these Attributes. And most importantly, it shows how those things talk to each other: we call these Relationships.
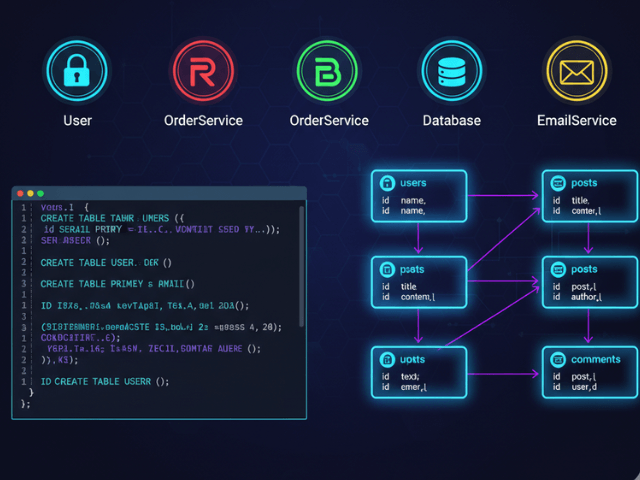
At its simplest level, it is a chart composed of rectangles connected by lines. The rectangles represent tables in a database (like “Users” or “Products”) and the lines represent how they link together (like “A User places an Order”).
Visualizing Database Structures and Relationships
An ERD transforms abstract SQL code into a picture. Instead of reading thousands of lines of code to understand how your data is organized, you can look at one diagram. You can see the flow of data. You can see which tables are the central hubs and which are the outliers. It makes the invisible logic of your database visible.
Why ERDs Matter in Database Design and Development
You might wonder why we bother drawing these maps. Why not just start coding the database? Skipping the ERD is like building a bridge without a drawing. You might get halfway across before realizing the two sides don’t meet.
Clarifying Data Models and System Requirements
Creating an ERD forces you to think clearly. When you have to draw a line between “Student” and “Class,” you have to make a decision. Can a student take many classes? Can a class have many students?
This is called cardinality. Deciding if a relationship is “one-to-one” or “one-to-many” or “many-to-many” is a fundamental architectural decision. The ERD forces you to answer these questions before you write code, which saves you from painful rewrites later.
Communicating Schema Across Teams
Software is a team sport. The backend developer designs the database. The frontend developer needs to display the data. The product manager needs to understand the business rules.
An ERD is a shared language. You don’t need to know SQL to read an ERD. A Product Manager can look at the diagram and say, “Wait a minute, why isn’t there a link between Customers and Support Tickets?” It allows non-technical stakeholders to catch logic errors in the system design.
Real-World Example: A Simple E-commerce ERD
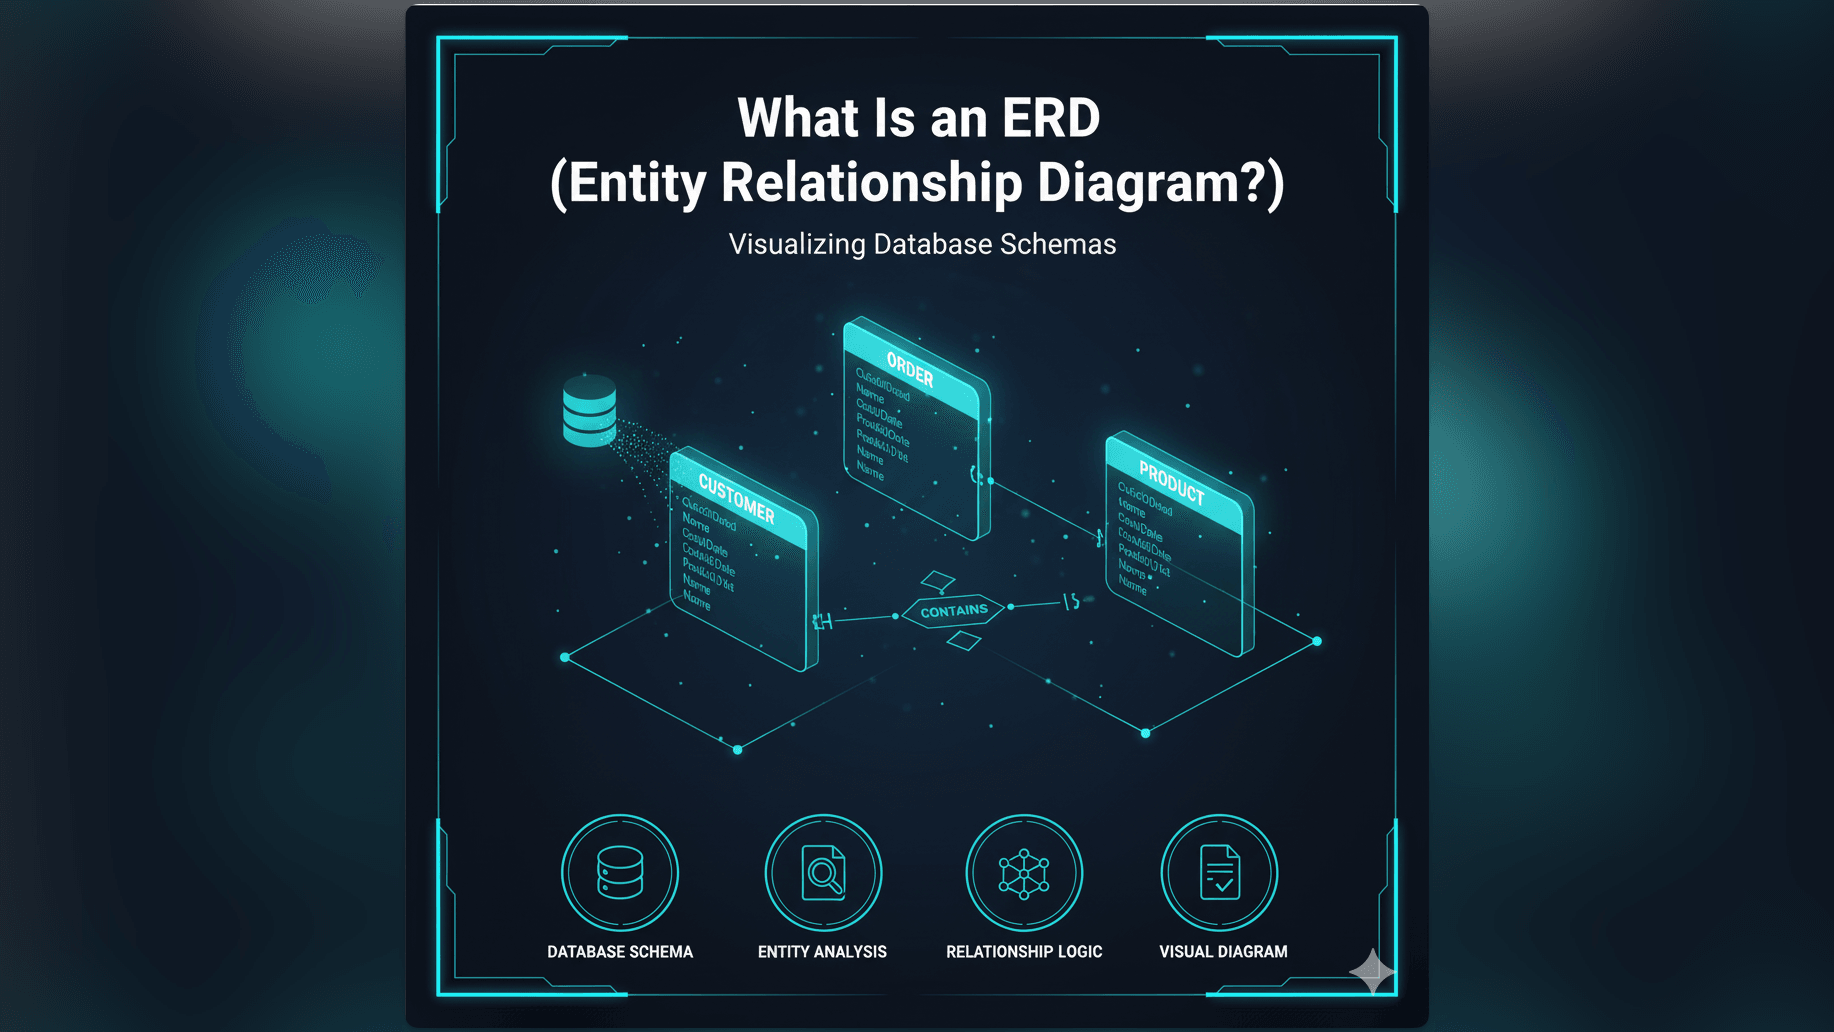
Let’s look at a classic example that powers almost every online store. Imagine an e-commerce site like Amazon. An ERD for this system would likely feature three main entities:
- Customer: This entity represents the person buying things. It would be a box containing attributes like Name, Email, and Shipping Address.
- Product: This entity represents the item being sold. Its box would list attributes like Price, Description, and Stock Quantity.
- Order: This is the transactional entity that links the other two.
Entities, Attributes, and Relationships in Practice
In the diagram, you would see a line connecting Customer to Order. The line would indicate that one Customer can place many Orders (a one-to-many relationship).
You would also see a line connecting Order to Product. Since an order can contain many products and a product can be in many orders, this creates a complex many-to-many relationship. Often the ERD will show a middle entity called Order Item to handle this link.
Looking at this visual creates instant clarity. You immediately understand that if you delete a Customer record, you might orphan their Order records. The diagram reveals the dependency.
How AI Diagram Maker Uses ERDs for Instant Schema Visualization
Traditionally developers drew these diagrams by hand. They would drag boxes onto a canvas and type out every column name. It was slow and tedious work.
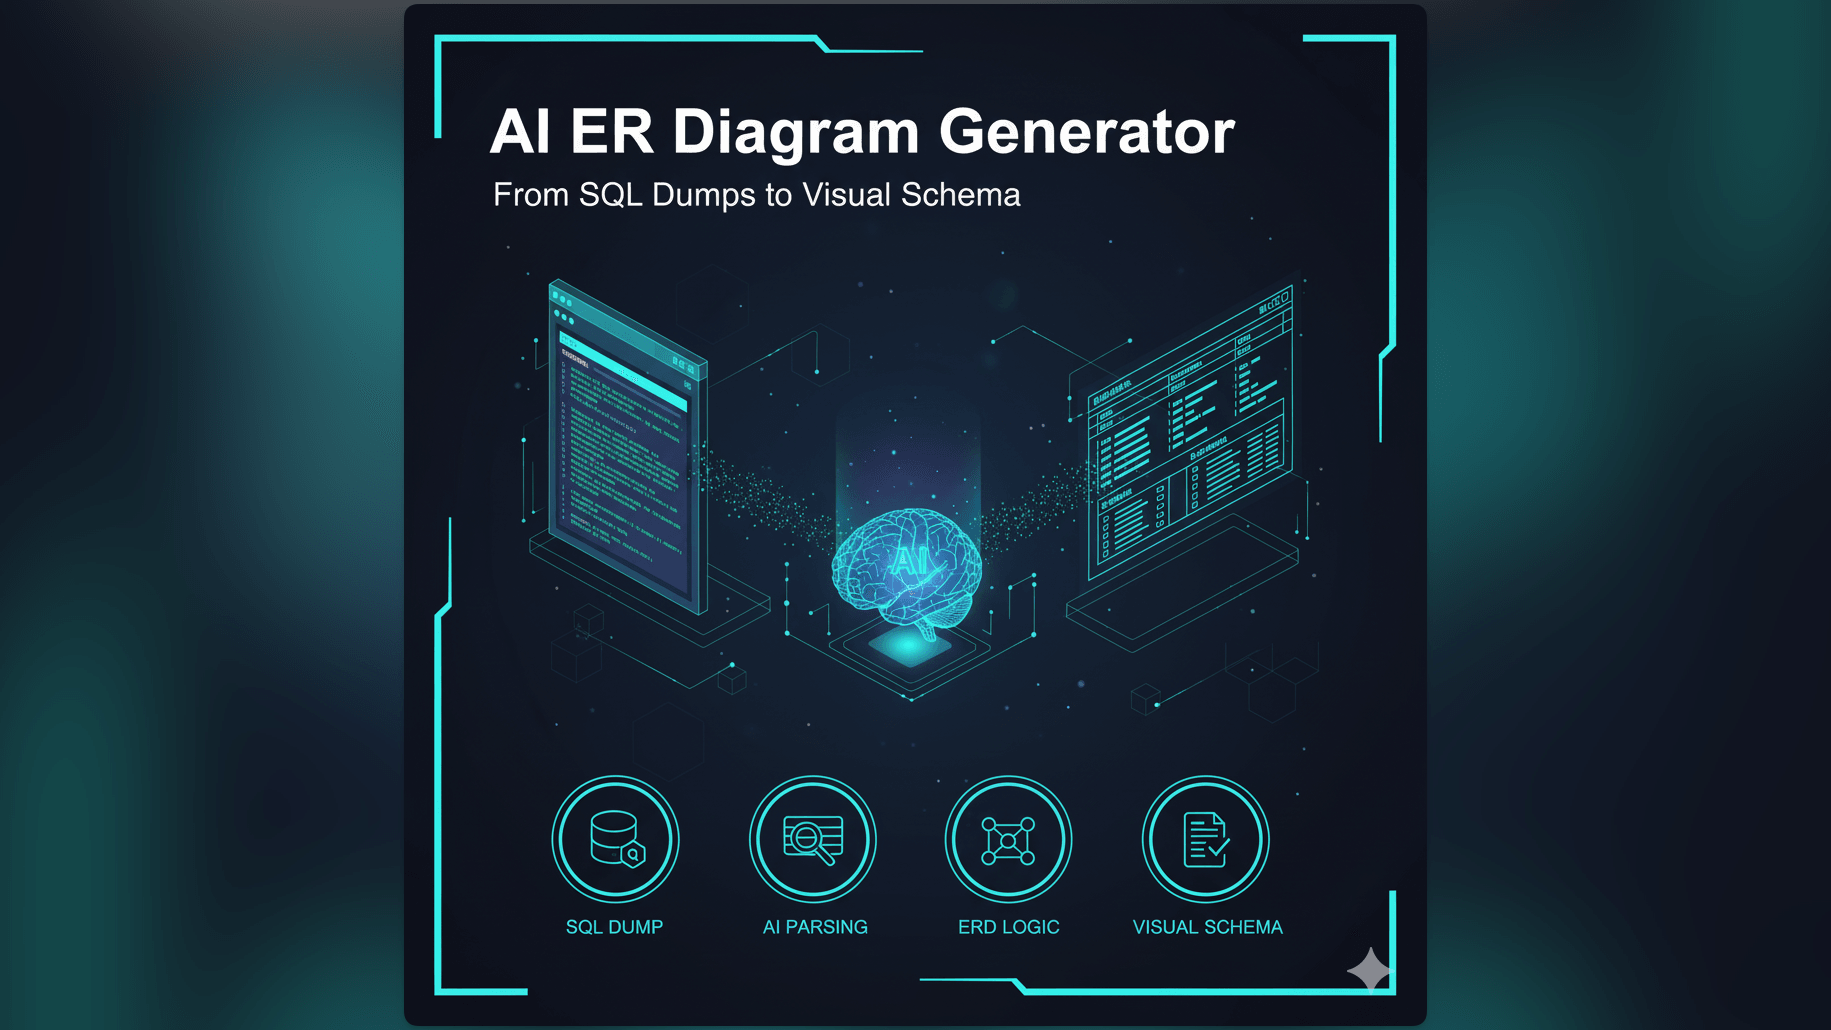
From SQL to Visual: Automated ERD Generation
With our AI ER Diagram Generator, we automate this process.
Instead of drawing, you can simply import your raw SQL code. If you have a database dump file, you paste it into the tool. Our AI reads the code and identifies the CREATE TABLE commands to find the entities. It finds the Primary Keys and Foreign Keys to figure out the relationships.
It then draws the ERD for you instantly. This allows you to “reverse engineer” a database. You can take a legacy database that nobody understands and generate a clear, accurate map of it in seconds. It turns a black box into a transparent blueprint.
Related Terms
To fully understand ERDs, you should be familiar with these related concepts:
- Entity: An object or concept stored in the database. In a diagram, it is usually represented by a rectangle. In a database, it becomes a Table.
- Relationship: The link between two entities. It shows how data in one table refers to data in another.
- Attribute: A specific detail about an entity. For a “User” entity, attributes would be things like “Username” or “Password.” In a database, these become Columns.
- Primary Key: A unique identifier for a specific record in a table. It ensures that every row is distinct. Read more about Primary Keys.
- Database Schema: The overall structure or organization of the database. The ERD is the visual representation of the schema.
For a deeper dive into how to create these diagrams automatically, check out our main guide on AI Diagramming.