What Are Microservices?
Microservices is an architectural style that structures an application as a collection of loosely coupled, independent services, offering scalability but introducing complexity compared to monolithic applications.
Microservices is an architectural style that structures an application as a collection of loosely coupled, independent services, offering scalability but introducing complexity compared to monolithic applications.
A monolithic architecture is a traditional model where an entire application is built as a single, unified unit, offering simplicity for smaller teams but posing challenges for scalability and independent deployments.

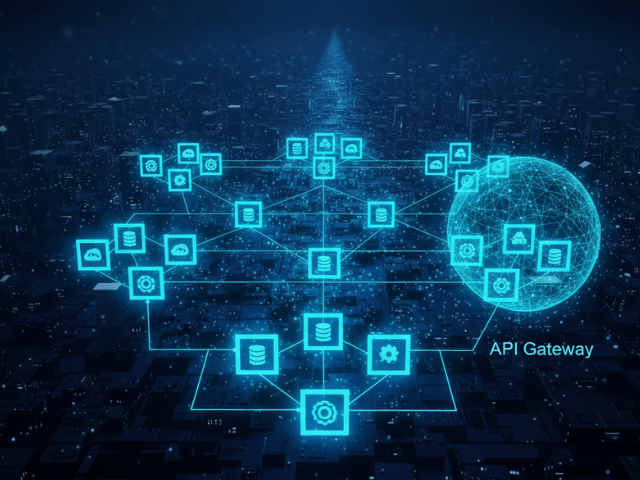
An API Gateway acts as an API front-end, receiving requests, enforcing policies, routing to backend services, and returning responses, serving as the central entry point for microservices architectures.

Asynchronous communication allows a sender to transmit a message without waiting for an immediate response, decoupling systems and improving performance for tasks like email queues and heavy processing.
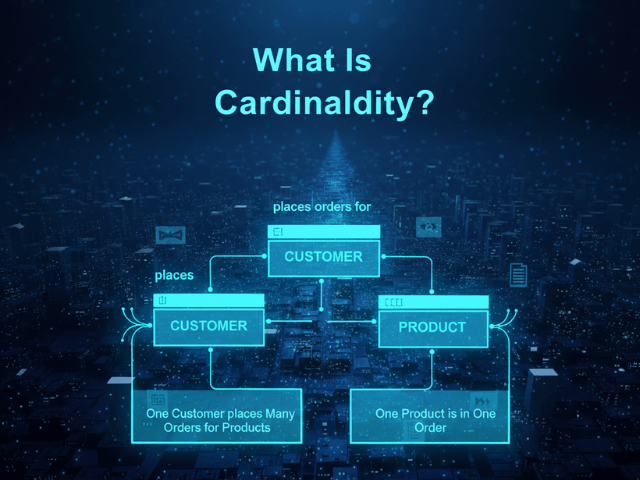
Cardinality defines the numerical relationship between rows in different tables within a database, specifying how many instances of one entity can be associated with instances of another.

Crow's Foot Notation is a standard visual language used in Entity Relationship Diagrams (ERDs) to represent relationships between entities, specifically their cardinality and optionality.
Latency is the time interval between a stimulation and a response in software, often measured in milliseconds, and is a critical factor in user experience and system performance.

Scalability is the measure of a system's ability to handle growth by adding resources. This glossary entry explains its types and importance in system design.
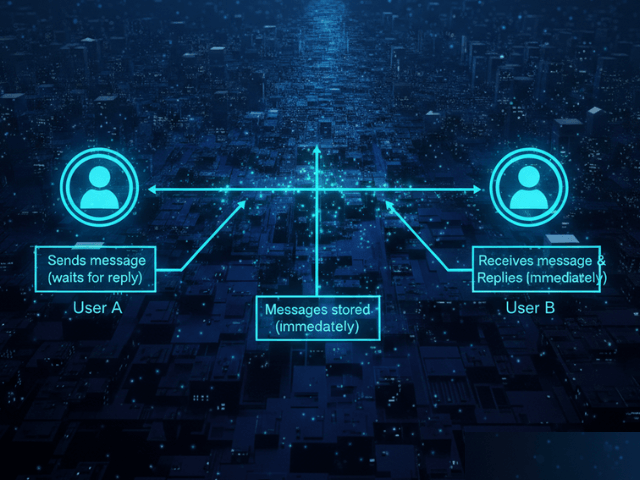
Synchronous communication is a pattern where the client sends a request and waits for the server to respond before continuing, creating a direct real-time connection often called blocking.
SVG (Scalable Vector Graphics) is an XML-based text format that describes two-dimensional images using mathematical instructions, allowing for infinite scaling without loss of quality, making it ideal for diagrams and technical documentation.